X

Financial report

| Financial result /IFRS/ | 2020 | 2021 | 2022 | 2023 | 2024 |
| Balance Sheet Indicators | (MNT million) | ||||
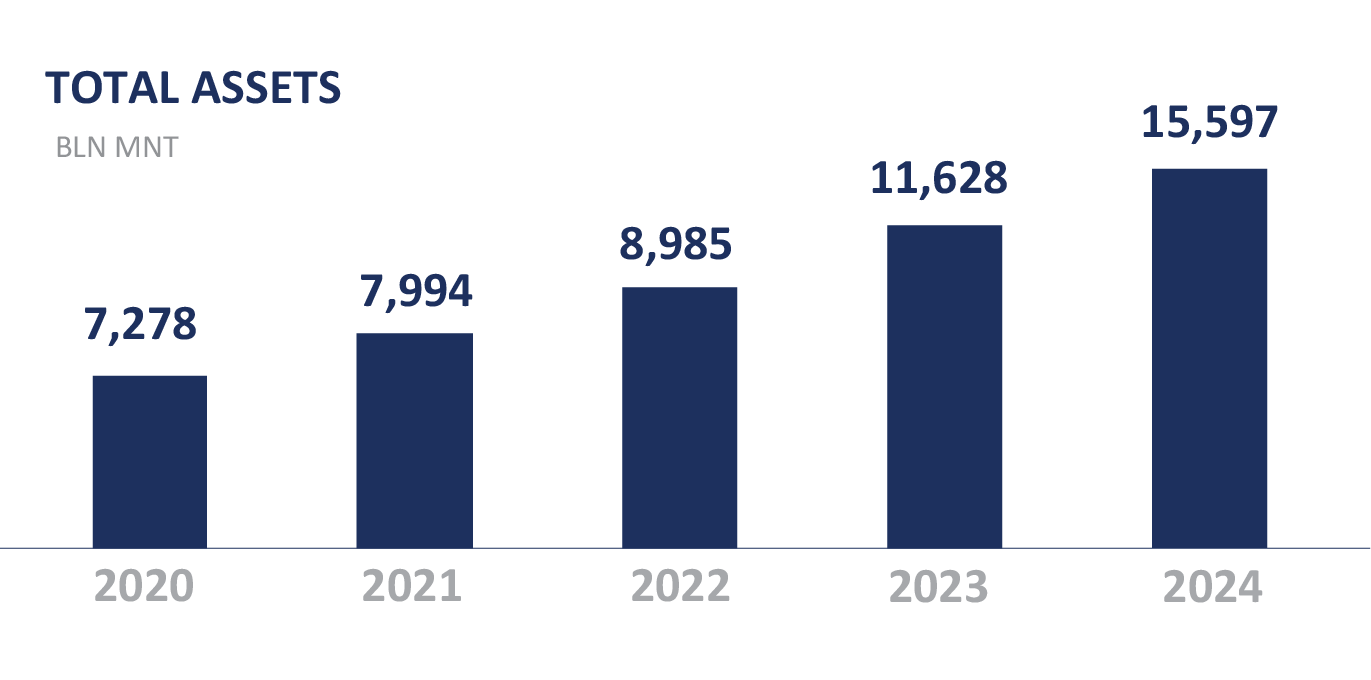
| Total Assets | 7,277,990 | 7,994,057 | 8,984,560 | 11,627,844 | 15,596,960 |
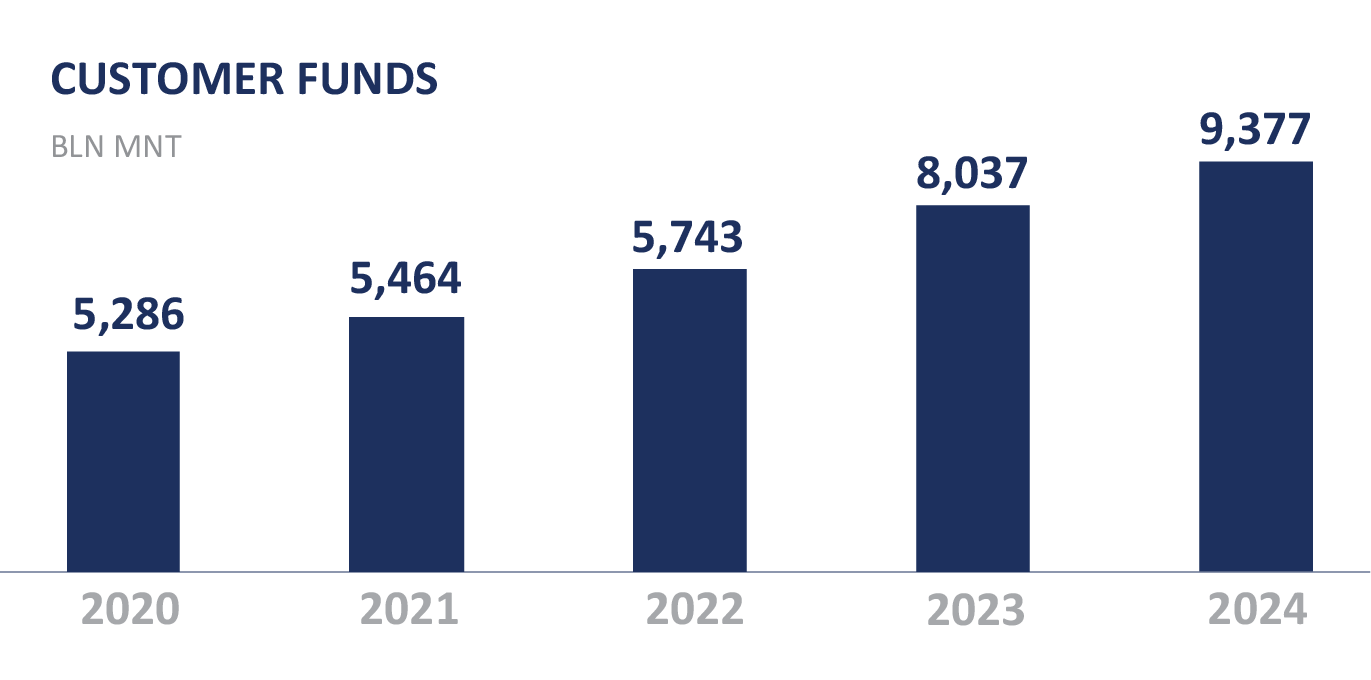
| Customer Funds | 5,285,675 | 5,463,543 | 5,743,298 | 8,036,634 | 9,376,843 |
| Bond fund | 1,369,878 | ||||
| Other funds | 1,236,992 | 1,748,141 | 2,180,054 | 2,253,595 | 3,237,504 |
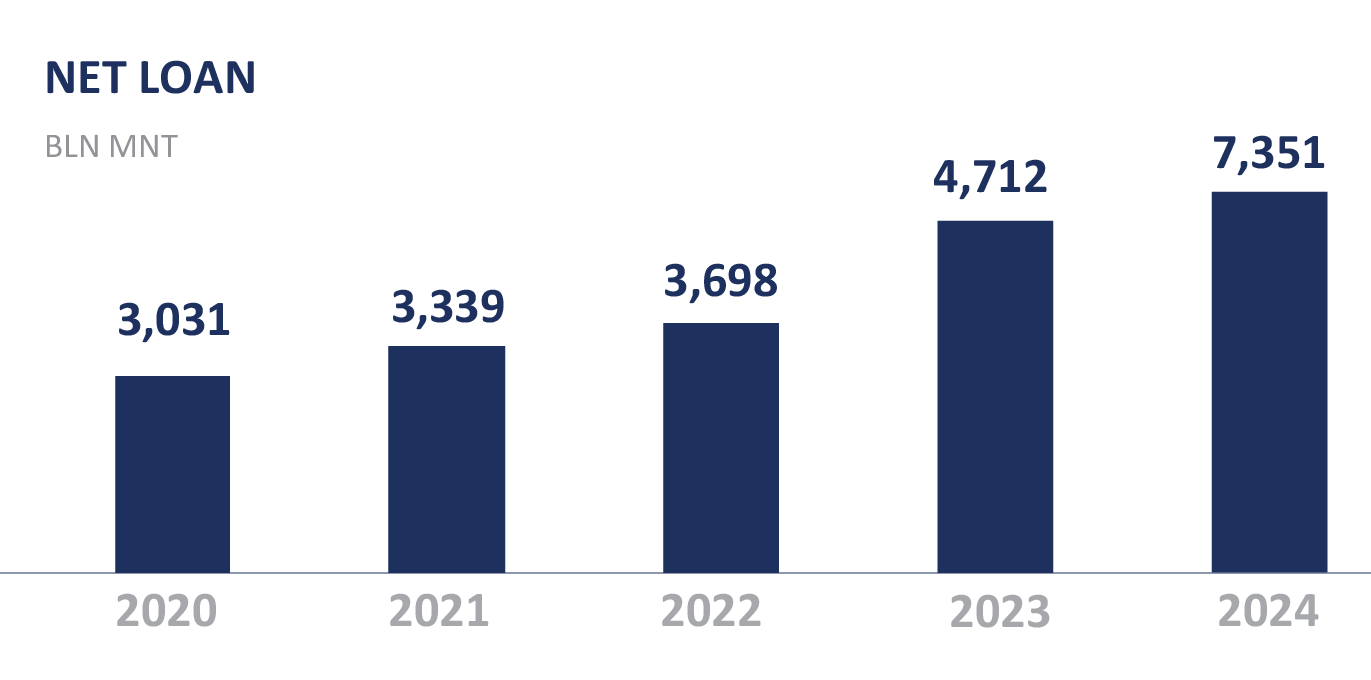
| Net Loans | 3,031,346 | 3,339,175 | 3,697,633 | 4,712,109 | 7,351,381 |
| Total Capital | 631,558 | 658,662 | 861,906 | 1,071,091 | 1,430,366 |
| Profitability Indicators | (MNT million) | ||||
| Interest Income | 570,132 | 554,778 | 609,909 | 840,733 | 1,163,189 |
| Interest Expense | (365,780) | (272,819) | (224,338) | (363,440) | (598,568) |
| Net Interest Income | 204,353 | 281,959 | 385,571 | 477,292 | 564,621 |
| Net Non-Interest Income | 82,543 | 48,579 | 141,678 | (23,542) | 202,810 |
| Operating Income | 286,895 | 330,538 | 527,248 | 453,750 | 767,430 |
| Operating Expense | (121,015) | (137,140) | (175,346) | (200,159) | (270,666) |
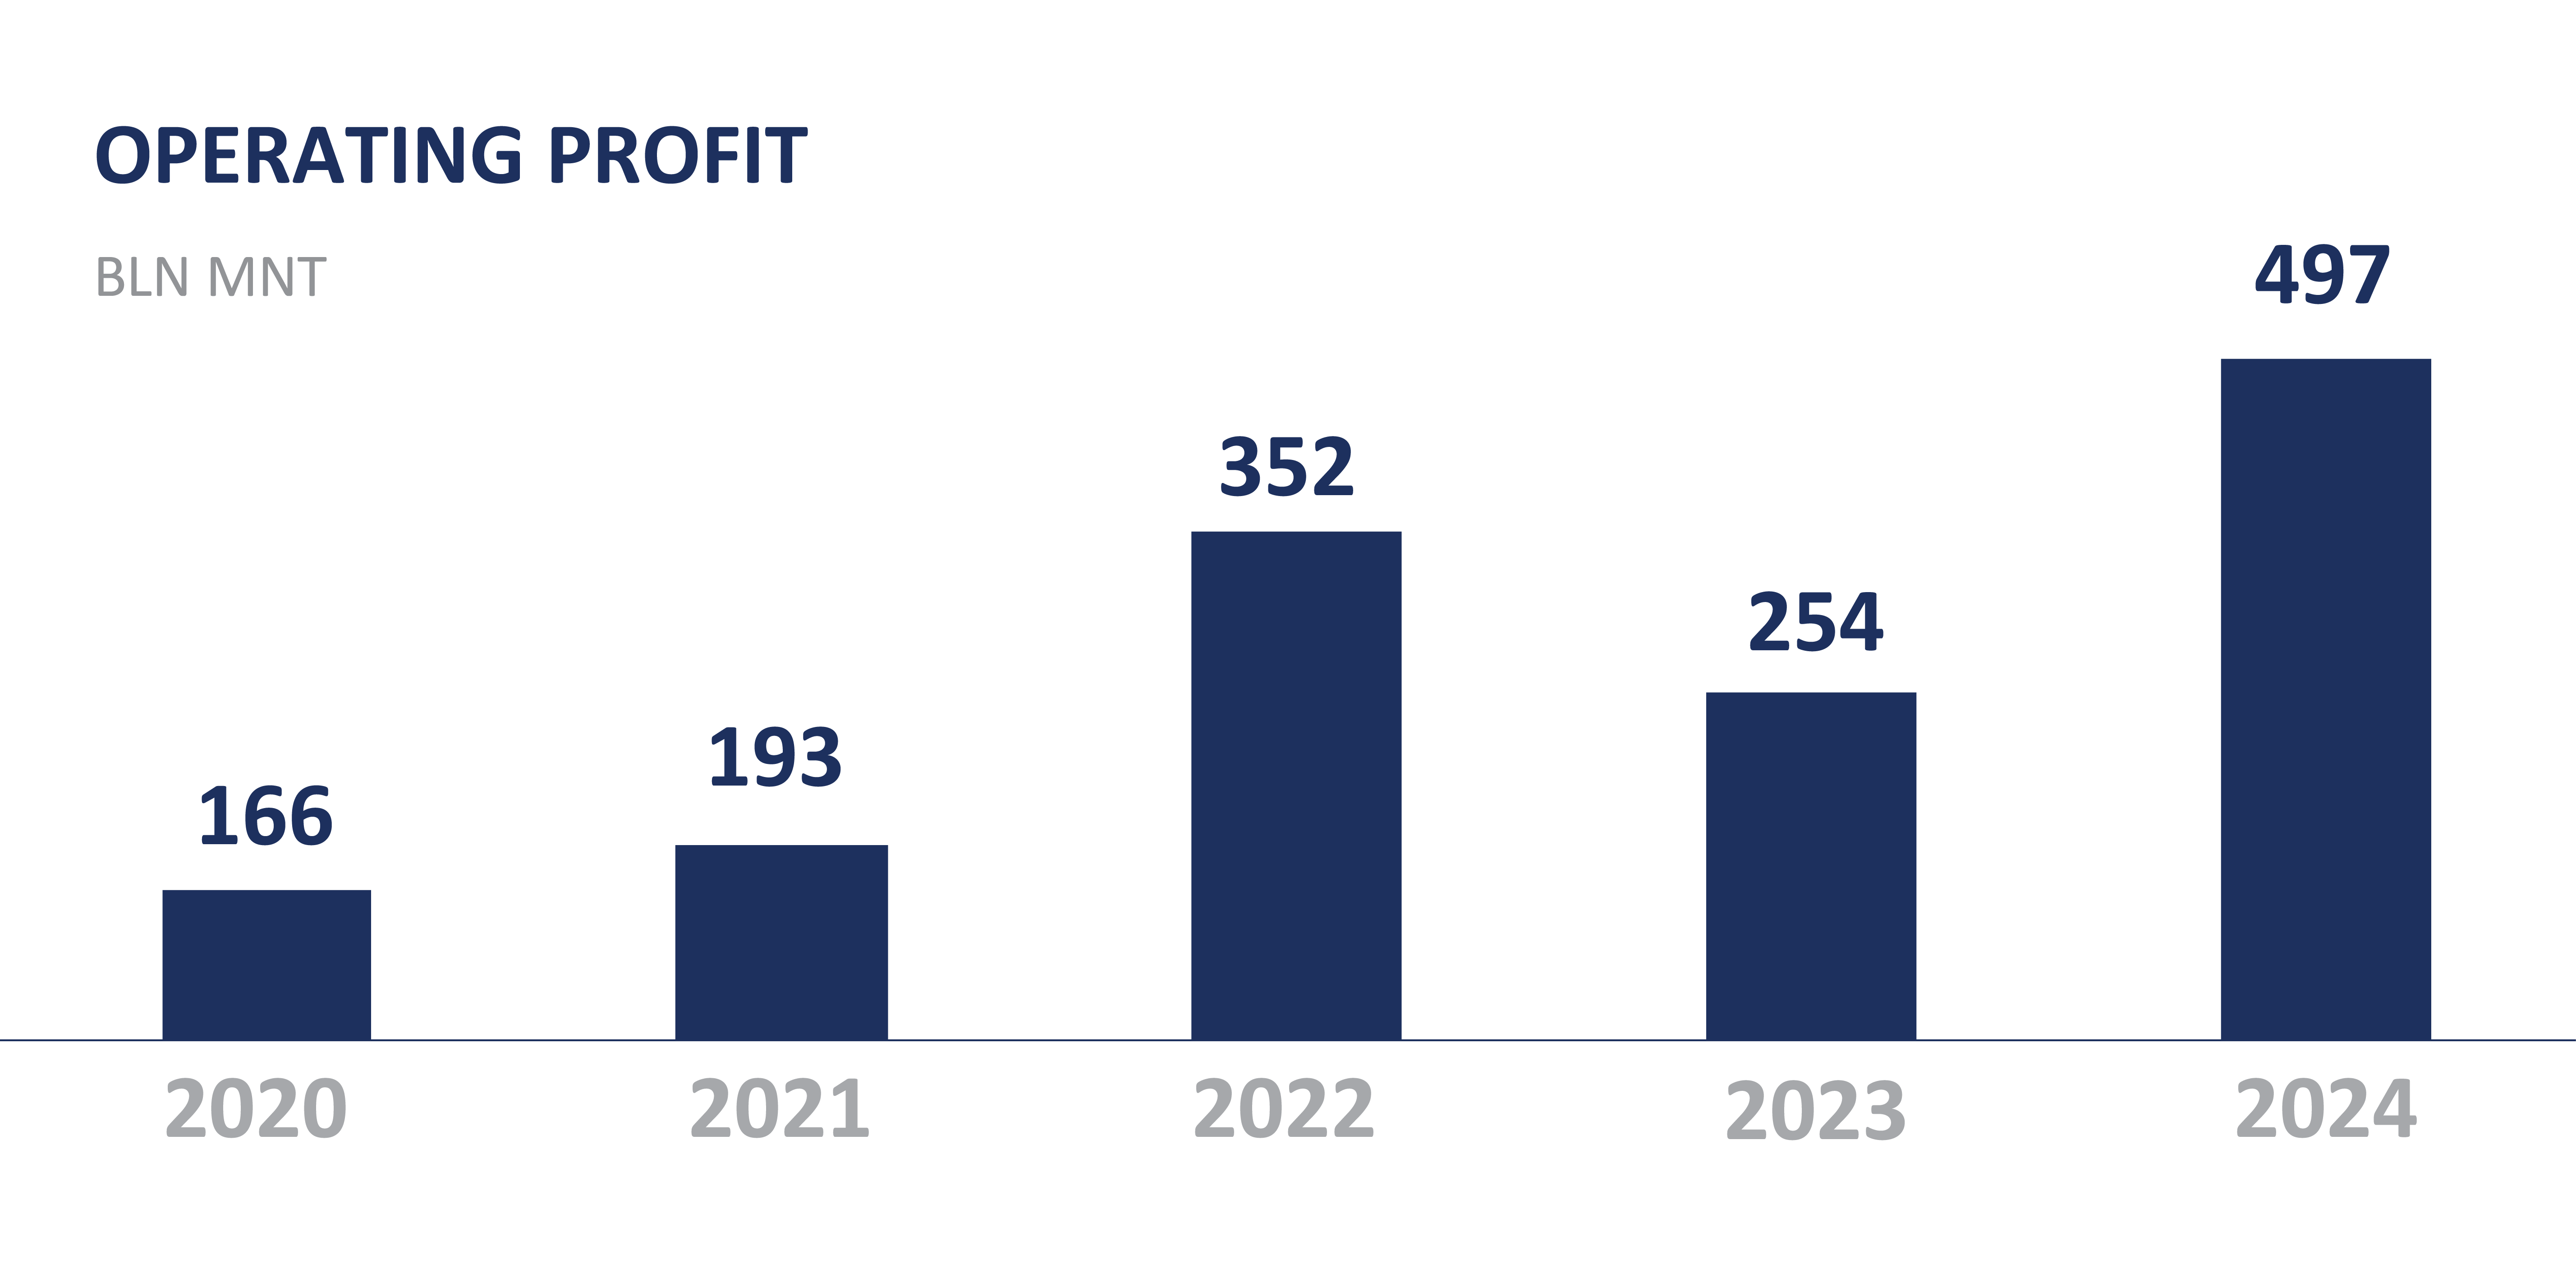
| Operating Profit | 165,881 | 193,398 | 351,903 | 253,591 | 496,764 |
| Provision & Valuation expense | (143,392) | (140,827) | (158,105) | 12,444 | 48,317 |
| Pre-Tax Profit | 22,489 | 52,571 | 193,798 | 266,035 | 545,081 |
| Taxation | (12,095) | (26,634) | (77,296) | (56,864) | (126,328) |
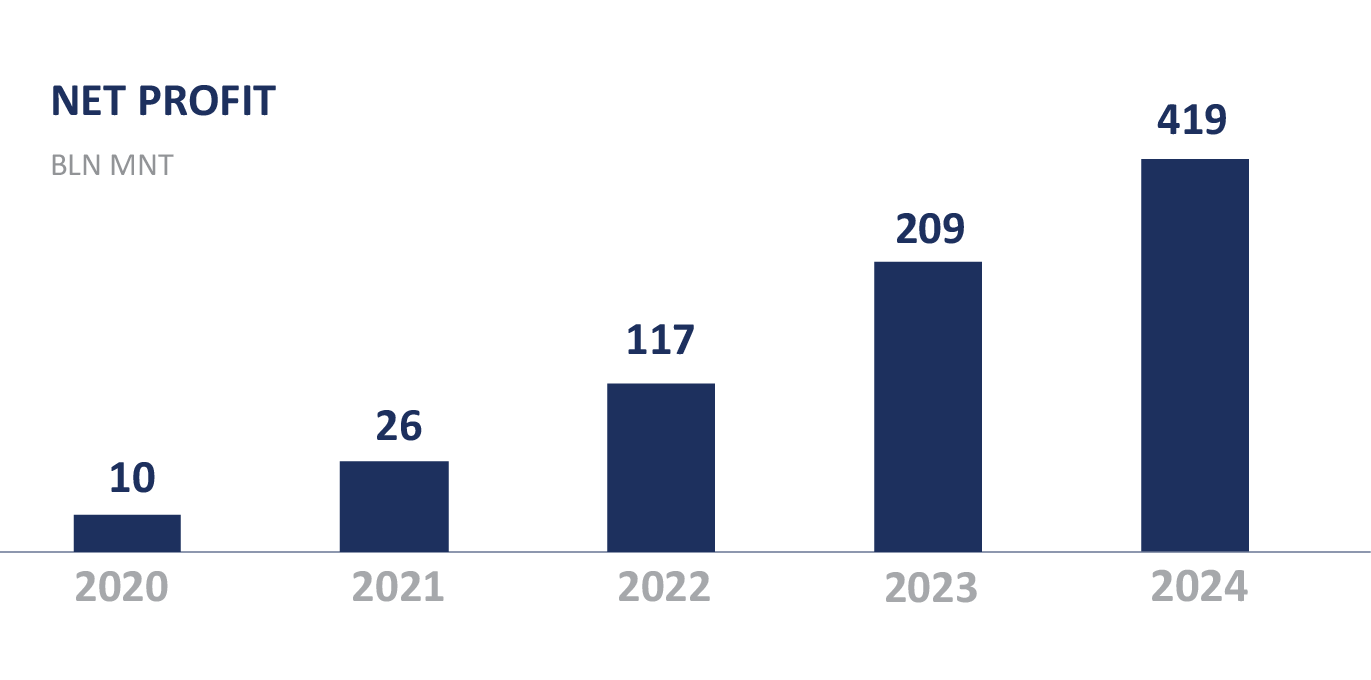
| Post -Tax Profit | 10,394 | 25,937 | 116,502 | 209,171 | 418,754 |
| Prudential Ratios* | *under BOM reporting rule | ||||
| Capital Adequacy Ratio >12% | 14.2% | 13.3% | 17.6% | 15.9% | 14.7% |
| Tier I ratio >9% (Buffer+4%) | 13.7% | 13.0% | 17.6% | 15.9% | 14.7% |
| Liquidity Ratio >25% | 40.2% | 41.3% | 36.3% | 38.3% | 35.4% |
This website uses google analytics
This website uses information gathering tool which is Google analytic in order to determine the effectiveness of our online campaign in terms of sales and user activity on our sites.