
UNAUDITED FINANCIAL STATEMENTS
2026/06/30 (In millions of MNT)
Balance sheet Items 1 ASSETS 1.1 Cash and cash equivalents 5,945,789 1.2 Deposits with other banks and financial institutions 1,383,350 1.3 Financial investments 2,369,232 1.3.1 Investments in subsidiary - 1.4 Loans and advances to customers (net) 8,730,130 1.4.1 Performing loans 8,633,005 1.4.2 Non-performing loans 222,676 1.4.3 Deferred loan payments (33,740) 1.4.4 Accrued interest receivables 68,196 1.4.5 Provision for loan impairment (160,007) 1.5 Derivative financial assets 327,122 1.6 Other financial assets 19,410 1.7 Other non-financial assets 149,467 1.8 Premises and equipments 765,623 1.9 Investment properties 9,064 1.10 Assets for sale 135,046 1.11 Intangible assets 25,534 Total assets 19,859,767 2 LIABILITIES 2.1 Current accounts 4,866,475 2.2 Savings 6,182,733 2.3 Due to other banks and financial institutions 3,107,659 2.4 Other funds 3,692,984 2.5 Other liabilities 278,402 Total liabilities 18,128,253 3 EQUITY 3.1 Share capital 202,164 3.2 Share premium 301,481 3.3 Treasury stock - 3.4 Revaluation surplus 14,475 3.5 Retained earnings 1,128,363 3.6 Other components of equity 85,031 3.6.1 Regulatory reserves 69,170 Provision for loan impairment 65,308 Provision for repossessed collaterals 3,862 3.6.2 Other 15,861 3.7 Total equity 1,731,514 4. Total liabilities and equity 19,859,767 Off-balance items Contingencies and commitments (net) 1,667,083 PRUDENTIAL RATIOS BY THE BANK OF MONGOLIA
Ratios Requirement Actual Tier 1 capital ratio > 9%+4% conservation buffer 15.05% Capital adequacy ratio >12% 15.05% Liquidity ratio >25% 41.94% Single foreign currency open position ratio <±15% 11.15% Total foreign currency open position ratio <±30% 14.85% INCOME STATEMENT
2026/06/30(In millions of MNT)
Income statement Items 1. Interest income 850,241 1.1. Balances with the Bank of Mongolia 7,924 1.2. Due from other banks and financial institutions 12,697 1.3. Investments in securities 191,649 1.4. Loans and advances to customers 622,172 1.5. Other 15,800 2. Interest expense 704,106 2.1. Current accounts 32,557 2.2. Savings 331,216 2.3. Borrowed funds 54,848 2.4. Securities 145,608 2.5. Other 139,876 3. Net interest income 146,135 4. Provision expenses 14,020 5. Net interest income after provision 132,115 6. Other income 235,396 6.1. Non-interest income 227,974 6.1.1. Trading income 62,152 6.1.2. Gains from foreign currency exchange translation and valuation 48,546 6.1.3. Fees and commission income 110,242 6.1.4. Other non-interest income 7,033 6.2. Other income 7,422 7. Other expense 207,938 7.1. Non-interest expense 204,767 7.1.1. Other provision expense 1,747 7.1.2. Trading expense - 7.1.3. Losses from foreign currency exchange translation and valuation - 7.1.4. Fees and commission expense 44,896 7.1.5. Other operating expense 158,124 7.2. Other expense 3,171 8. Profit before tax 159,573 9. Income tax expense 25,327 10. Profit after tax 134,246 11. Other comprehensive income 33 12. Total comprehensive income 134,279 ![2026_Q2_Financial_report]()
UNAUDITED FINANCIAL STATEMENTS
2026/03/31 (In millions of MNT)
Balance sheet Items 1 ASSETS 1.1 Cash and cash equivalents 4,946,741 1.2 Deposits with other banks and financial institutions 1,410,968 1.3 Financial investments 2,550,205 1.3.1 Investments in subsidiary - 1.4 Loans and advances to customers (net) 7,970,162 1.4.1 Performing loans 7,860,212 1.4.2 Non-performing loans 226,581 1.4.3 Deferred loan payments (30,215) 1.4.4 Accrued interest receivables 72,266 1.4.5 Provision for loan impairment (158,682) 1.5 Derivative financial assets 241,885 1.6 Other financial assets 20,004 1.7 Other non-financial assets 108,333 1.8 Premises and equipments 717,265 1.9 Investment properties 9,064 1.10 Assets for sale 157,791 1.11 Intangible assets 27,229 Total assets 18,159,647 2 LIABILITIES 2.1 Current accounts 3,775,004 2.2 Savings 6,329,381 2.3 Due to other banks and financial institutions 3,410,300 2.4 Other funds 2,702,883 2.5 Other liabilities 236,189 Total liabilities 16,453,757 3 EQUITY 3.1 Share capital 202,164 3.2 Share premium 301,481 3.3 Treasury stock - 3.4 Revaluation surplus 14,475 3.5 Retained earnings 1,102,747 3.6 Other components of equity 85,023 3.6.1 Regulatory reserves 69,170 Provision for loan impairment 65,308 Provision for repossessed collaterals 3,862 3.6.2 Other 15,852 Total equity 1,705,890 Total liabilities and equity 18,159,647 Off-balance items Contingencies and commitments (net) 1,613,461 PRUDENTIAL RATIOS BY THE BANK OF MONGOLIA
Ratios Requirement Actual Tier 1 capital ratio > 9%+4% conservation buffer 16.03% Capital adequacy ratio >12% 16.03% Liquidity ratio >25% 41.09% Single foreign currency open position ratio <±15% -1.03% Total foreign currency open position ratio <±30% -4.62% INCOME STATEMENT
2026/03/31(In millions of MNT)
Income statement Items 1. Interest income 408,884 1.1. Balances with the Bank of Mongolia 4,733 1.2. Due from other banks and financial institutions 6,242 1.3. Investments in securities 88,717 1.4. Loans and advances to customers 301,798 1.5. Other 7,394 2. Interest expense 318,693 2.1. Current accounts 14,515 2.2. Savings 162,356 2.3. Borrowed funds 26,500 2.4. Securities 47,323 2.5. Other 67,999 3. Net interest income 90,191 4. Provision expenses 12,700 5. Net interest income after provision 77,491 6. Other income 81,324 6.1. Non-interest income 79,723 6.1.1. Trading income 10,478 6.1.2. Gains from foreign currency exchange translation and valuation - 6.1.3. Fees and commission income 69,240 6.1.4. Other non-interest income 5 6.2. Other income 1,601 7. Other expense 105,589 7.1. Non-interest expense 104,293 7.1.1. Other provision expense 7,824 7.1.2. Trading expense - 7.1.3. Losses from foreign currency exchange translation and valuation 6,291 7.1.4. Fees and commission expense 22,493 7.1.5. Other operating expense 67,685 7.2. Other expense 1,296 8. Profit before tax 53,226 9. Income tax expense 9,288 10. Profit after tax 43,938 11. Other comprehensive income 14 12. Total comprehensive income 43,952 ![2026_Q1_Financial_report]()
UNAUDITED FINANCIAL STATEMENTS
2025/12/31 (In millions of MNT)
Balance sheet Items 1 ASSETS 1.1 Cash and cash equivalents 6,835,901 1.2 Deposits with other banks and financial institutions 1,249,656 1.3 Financial investments 1,564,943 1.3.1 Investments in subsidiary - 1.4 Loans and advances to customers (net) 8,083,875 1.4.1 Performing loans 8,047,880 1.4.2 Non-performing loans 210,128 1.4.3 Deferred loan payments (27,965) 1.4.4 Accrued interest receivables 67,604 1.4.5 Provision for loan impairment (213,772) 1.5 Derivative financial assets 251,976 1.6 Other financial assets 31,739 1.7 Other non-financial assets 190,523 1.8 Premises and equipments 708,398 1.9 Investment properties 6,587 1.10 Assets for sale 65,423 1.11 Intangible assets 28,365 Total assets 19,017,386 2 LIABILITIES 2.1 Current accounts 3,888,016 2.2 Savings 5,969,474 2.3 Due to other banks and financial institutions 4,420,526 2.4 Other funds 2,935,720 2.5 Other liabilities 244,145 Total liabilities 17,457,881 3 EQUITY 3.1 Share capital 202,164 3.2 Share premium 301,481 3.3 Treasury stock - 3.4 Revaluation surplus 14,475 3.5 Retained earnings 1,031,152 3.6 Other components of equity 10,232 Total equity 1,559,505 Total liabilities and equity 19,017,386 Off-balance items Contingencies and commitments (net) 1,681,400 PRUDENTIAL RATIOS BY THE BANK OF MONGOLIA
Ratios Requirement Actual Tier 1 capital ratio > 9%+4% conservation buffer 15.34% Capital adequacy ratio >12% 15.34% Liquidity ratio >25% 36.88% Single foreign currency open position ratio <±15% -0.97% Total foreign currency open position ratio <±30% -2.91% INCOME STATEMENT
2025/12/31(In millions of MNT)
Income statement Items 1. Interest income 1,638,467 1.1. Balances with the Bank of Mongolia 12,640 1.2. Due from other banks and financial institutions 8,413 1.3. Investments in securities 218,121 1.4. Loans and advances to customers 1,217,273 1.5. Other 182,019 2. Interest expense 1,169,596 2.1. Current accounts 37,423 2.2. Savings 565,880 2.3. Borrowed funds 78,272 2.4. Securities 182,041 2.5. Other 305,980 3. Net interest income 468,870 4. Provision expenses - 5. Net interest income after provision 468,870 6. Other income 394,444 6.1. Non-interest income 337,562 6.1.1. Trading income 126,897 6.1.2. Gains from foreign currency exchange translation and valuation - 6.1.3. Fees and commission income 143,800 6.1.4. Other non-interest income 66,864 6.2. Other income 56,882 7. Other expense 433,711 7.1. Non-interest expense 425,474 7.1.1. Other provision expense 4,347 7.1.2. Trading expense - 7.1.3. Losses from foreign currency exchange translation and valuation 8,854 7.1.4. Fees and commission expense 93,314 7.1.5. Other operating expense 318,959 7.2. Other expense 8,236 8. Profit before tax 429,603 9. Income tax expense 84,494 10. Profit after tax 345,109 11. Other comprehensive income 19 12. Total comprehensive income 345,128 ![20260116_ulirliin-_sanhuugiin_tailan_q4_en_2]()
UNAUDITED FINANCIAL STATEMENTS
2025/09/30 (In millions of MNT)
Balance sheet Items 1. ASSETS 1.1. Cash and cash equivalents 4,503,947 1.2. Deposits with other banks and financial institutions 766,092 1.3 Financial investments 1,501,114 1.3.1. Investments in subsidiary - 1.4. Loans and advances to customers (net) 7,623,873 1.4.1. Performing loans 7,582,778 1.4.2. Non-performing loans 252,054 1.4.3. Deferred loan payments (31,099) 1.4.4. Accrued interest receivables 74,234 1.4.5. Provision for loan impairment (254,093) 1.5. Derivative financial assets 247,146 1.6. Other financial assets 28,261 1.7. Other non-financial assets 78,706 1.8. Premises and equipments 682,691 1.9. Investment properties 6,586 1.10. Assets for sale 94,315 1.11. Intangible assets 28,245 Total assets 15,560,979 2. LIABILITIES 2.1. Current accounts 3,656,008 2.2. Savings 5,397,160 2.3. Due to other banks and financial institutions 2,863,398 2.4. Other funds 1,933,820 2.5. Other liabilities 245,002 Total liabilities 14,095,388 3. EQUITY 3.1. Share capital 202,164 3.2. Share premium 301,481 3.3. Treasury stock - 3.4. Revaluation surplus 14,902 3.5. Retained earnings 936,819 3.6. Other components of equity 10,224 Total equity 1,465,591 Total liabilities and equity 15,560,979 Off-balance items Contingencies and commitments (net) 1,547,480 PRUDENTIAL RATIOS BY THE BANK OF MONGOLIA
Ratios Requirement Actual Tier 1 capital ratio > 9%+4% conservation buffer 15.08% Capital adequacy ratio >12% 15.08% Liquidity ratio >25% 36.25% Single foreign currency open position ratio <±15% 9.06% Total foreign currency open position ratio <±30% 11.45% INCOME STATEMENT
2025/09/30(In millions of MNT)
Income statement Items 1. Interest income 1,194,901 1.1. Balances with the Bank of Mongolia 8,796 1.2. Due from other banks and financial institutions 5,629 1.3. Investments in securities 152,655 1.4. Loans and advances to customers 890,997 1.5. Other 136,825 2. Interest expense 854,267 2.1. Current accounts 44,991 2.2. Savings 394,788 2.3. Borrowed funds 58,935 2.4. Securities 132,874 2.5. Other 222,679 3. Net interest income 340,634 4. Provision expenses - 5. Net interest income after provision 340,634 6. Other income 336,446 6.1. Non-interest income 286,891 6.1.1. Trading income 154,558 6.1.2. Gains from foreign currency exchange translation and valuation - 6.1.3. Fees and commission income 104,180 6.1.4. Other non-interest income 28,153 6.2. Other income 49,555 7. Other expense 367,227 7.1. Non-interest expense 364,843 7.1.1. Other provision expense 3,974 7.1.2. Trading expense - 7.1.3. Losses from foreign currency exchange translation and valuation 80,422 7.1.4. Fees and commission expense 69,669 7.1.5. Other operating expense 210,779 7.2. Other expense 2,384 8. Profit before tax 309,853 9. Income tax expense 58,508 10. Profit after tax 251,345 11. Other comprehensive income (6) 12. Total comprehensive income 251,339 Net profit after tax /bln mnt/
![2025Q3]()
UNAUDITED FINANCIAL STATEMENTS
2025/06/30 (In millions of MNT)
Balance sheet Items 1. ASSETS 1.1. Cash and cash equivalents 3,802,605 1.2. Deposits with other banks and financial institutions 706,521 1.3 Financial investments 1,350,239 1.3.1. Investments in subsidiary - 1.4. Loans and advances to customers (net) 7,917,654 1.4.1. Performing loans 7,904,420 1.4.2. Non-performing loans 223,498 1.4.3. Deferred loan payments (33,654) 1.4.4. Accrued interest receivables 62,634 1.4.5. Provision for loan impairment (239,244) 1.5. Derivative financial assets 281,207 1.6. Other financial assets 27,897 1.7. Other non-financial assets 92,104 1.8. Premises and equipments 663,938 1.9. Investment properties 6,586 1.10. Assets for sale 65,277 1.11. Intangible assets 28,590 Total assets 14,942,618 2. LIABILITIES 2.1. Current accounts 3,478,132 2.2. Savings 5,342,576 2.3. Due to other banks and financial institutions 2,775,454 2.4. Other funds 1,734,224 2.5. Other liabilities 182,771 Total liabilities 13,513,156 3. EQUITY 3.1. Share capital 202,164 3.2. Share premium 301,481 3.3. Treasury stock - 3.4. Revaluation surplus 14,902 3.5. Retained earnings 900,679 3.6. Other components of equity 10,235 Total equity 1,429,462 Total liabilities and equity 14,942,618 Off-balance items Contingencies and commitments (net) 1,427,327 PRUDENTIAL RATIOS BY THE BANK OF MONGOLIA
Ratios Requirement Actual Tier 1 capital ratio > 9%+4% conservation buffer 14.90% Capital adequacy ratio >12% 14.90% Liquidity ratio >25% 32.13% Single foreign currency open position ratio <±15% 1.02% Total foreign currency open position ratio <±30% -2.83% INCOME STATEMENT
2025/06/30(In millions of MNT)
Income statement Items 1. Interest income 790,667 1.1. Balances with the Bank of Mongolia 5,033 1.2. Due from other banks and financial institutions 3,607 1.3. Investments in securities 106,458 1.4. Loans and advances to customers 583,066 1.5. Other 92,504 2. Interest expense 563,613 2.1. Current accounts 31,199 2.2. Savings 258,234 2.3. Borrowed funds 40,335 2.4. Securities 89,731 2.5. Other 144,115 3. Net interest income 227,054 4. Provision expenses - 5. Net interest income after provision 227,054 6. Other income 267,459 6.1. Non-interest income 223,373 6.1.1. Trading income 112,910 6.1.2. Gains from foreign currency exchange translation and valuation - 6.1.3. Fees and commission income 66,784 6.1.4. Other non-interest income 43,679 6.2. Other income 44,086 7. Other expense 228,978 7.1. Non-interest expense 227,267 7.1.1. Other provision expense 12,283 7.1.2. Trading expense - 7.1.3. Losses from foreign currency exchange translation and valuation 42,029 7.1.4. Fees and commission expense 42,566 7.1.5. Other operating expense 130,388 7.2. Other expense 1,711 8. Profit before tax 265,535 9. Income tax expense 50,331 10. Profit after tax 215,205 11. Other comprehensive income (6) 12. Total comprehensive income 215,199 Net profit after tax /bln mnt/
![20250721-2025Q2]()
UNAUDITED FINANCIAL STATEMENTS
2025/03/31 (In millions of MNT)
Balance sheet Items 1. ASSETS 1.1. Cash and cash equivalents 4,377,529 1.2. Deposits with other banks and financial institutions 1,065,206 1.3 Financial investments 1,309,420 1.3.1. Investments in subsidiary - 1.4. Loans and advances to customers (net) 7,460,023 1.4.1. Performing loans 7,429,014 1.4.2. Non-performing loans 240,793 1.4.3. Deferred loan payments (30,215) 1.4.4. Accrued interest receivables 80,984 1.4.5. Provision for loan impairment (260,553) 1.5. Derivative financial assets 306,937 1.6. Other financial assets 17,631 1.7. Other non-financial assets 181,153 1.8. Premises and equipments 624,609 1.9. Investment properties 6,586 1.10. Assets for sale 44,573 1.11. Intangible assets 22,730 Total assets 15,416,398 2. LIABILITIES 2.1. Current accounts 3,306,148 2.2. Savings 5,152,098 2.3. Due to other banks and financial institutions 2,269,387 2.4. Other funds 3,095,307 2.5. Other liabilities 206,034 Total liabilities 14,028,974 3. EQUITY 3.1. Share capital 202,164 3.2. Share premium 301,481 3.3. Treasury stock - 3.4. Revaluation surplus 6,186 3.5. Retained earnings 871,346 3.6. Other components of equity 6,246 Total equity 1,387,424 Total liabilities and equity 15,416,398 Off-balance items Contingencies and commitments (net) 1,318,374 PRUDENTIAL RATIOS BY THE BANK OF MONGOLIA
Ratios Requirement Actual Tier 1 capital ratio > 9%+4% conservation buffer 15.45% Capital adequacy ratio >12% 15.45% Liquidity ratio >25% 33.98% Single foreign currency open position ratio <±15% 5.76% Total foreign currency open position ratio <±30% 13.72% INCOME STATEMENT
2025/03/31 (In millions of MNT)
Income statement Items 1. Interest income 389,319 1.1. Balances with the Bank of Mongolia 3,877 1.2. Due from other banks and financial institutions 2,212 1.3. Investments in securities 56,099 1.4. Loans and advances to customers 282,742 1.5. Other 44,389 2. Interest expense 275,896 2.1. Current accounts 12,317 2.2. Savings 132,590 2.3. Borrowed funds 20,367 2.4. Securities 42,621 2.5. Other 68,000 3. Net interest income 113,423 4. Provision expenses - 5. Net interest income after provision 113,423 6. Other income 122,029 6.1. Non-interest income 101,900 6.1.1. Trading income 15,813 6.1.2. Gains from foreign currency exchange translation and valuation 42,909 6.1.3. Fees and commission income 30,360 6.1.4. Other non-interest income 12,818 6.2. Other income 20,129 7. Other expense 82,399 7.1. Non-interest expense 81,641 7.1.1. Other provision expense 163 7.1.2. Trading expense - 7.1.3. Losses from foreign currency exchange translation and valuation - 7.1.4. Fees and commission expense 20,544 7.1.5. Other operating expense 60,934 7.2. Other expense 758 8. Profit before tax 153,053 9. Income tax expense 35,591 10. Profit after tax 117,462 11. Other comprehensive income 11 12. Total comprehensive income 117,473 Net profit after tax /bln mnt/
![info_2024h1-01]()
UNAUDITED FINANCIAL STATEMENTS
2024/12/31 (In millions of MNT)
Balance sheet Items 1. ASSETS 1.1. Cash and cash equivalents 5,012,140 1.2. Deposits with other banks and financial institutions 952,907 1.3 Financial investments 1,249,253 1.3.1. Investments in subsidiary - 1.4. Loans and advances to customers (net) 7,219,078 1.4.1. Performing loans 7,227,014 1.4.2. Non-performing loans 225,782 1.4.3. Deferred loan payments (29,378) 1.4.4. Accrued interest receivables 67,937 1.4.5. Provision for loan impairment (272,276) 1.5. Derivative financial assets 235,288 1.6. Other financial assets 12,536 1.7. Other non-financial assets 56,578 1.8. Premises and equipments 615,595 1.9. Investment properties 6,586 1.10. Assets for sale 26,178 1.11. Intangible assets 24,023 Total assets 15,410,163 2. LIABILITIES 2.1. Current accounts 3,663,806 2.2. Savings 4,866,240 2.3. Due to other banks and financial institutions 2,546,498 2.4. Other funds 2,910,711 2.5. Other liabilities 152,952 Total liabilities 14,140,207 3. EQUITY 3.1. Share capital 202,164 3.2. Share premium 301,481 3.3. Treasury stock - 3.4. Revaluation surplus 6,186 3.5. Retained earnings 753,884 3.6. Other components of equity 6,239 Total equity 1,269,956 Total liabilities and equity 15,410,163 Off-balance items Contingencies and commitments (net) 1,550,896 PRUDENTIAL RATIOS BY THE BANK OF MONGOLIA
Ratios Requirement Actual Tier 1 capital ratio > 9%+4% conservation buffer 14.67% Capital adequacy ratio >12% 14.67% Liquidity ratio >25% 35.42% Single foreign currency open position ratio <±15% -2.12% Total foreign currency open position ratio <±30% -6.66% INCOME STATEMENT
2024/12/31 (In millions of MNT)
Income statement Items 1. Interest income 1,299,725 1.1. Balances with the Bank of Mongolia 16,093 1.2. Due from other banks and financial institutions 12,287 1.3. Investments in securities 189,206 1.4. Loans and advances to customers 929,360 1.5. Other 152,778 2. Interest expense 779,764 2.1. Current accounts 69,300 2.2. Savings 366,587 2.3. Borrowed funds 79,336 2.4. Securities 79,492 2.5. Other 185,049 3. Net interest income 519,961 4. Provision expenses 20,136 5. Net interest income after provision 499,825 6. Other income 400,345 6.1. Non-interest income 365,494 6.1.1. Trading income 164,851 6.1.2. Gains from foreign currency exchange translation and valuation 31,143 6.1.3. Fees and commission income 125,978 6.1.4. Other non-interest income 43,522 6.2. Other income 34,851 7. Other expense 369,190 7.1. Non-interest expense 358,611 7.1.1. Other provision expense 13,666 7.1.2. Trading expense - 7.1.3. Losses from foreign currency exchange translation and valuation - 7.1.4. Fees and commission expense 77,407 7.1.5. Other operating expense 267,537 7.2. Other expense 10,579 8. Profit before tax 530,980 9. Income tax expense 124,268 10. Profit after tax 406,712 11. Other comprehensive income 587 12. Total comprehensive income 407,298 ![info_2024q4-en]()
UNAUDITED FINANCIAL STATEMENTS
2024/09/30 (In millions of MNT)
Balance sheet Items 1. ASSETS 1.1. Cash and cash equivalents 2,644,890 1.2. Deposits with other banks and financial institutions 842,609 1.3 Financial investments 1,046,702 1.3.1. Investments in subsidiary - 1.4. Loans and advances to customers (net) 6,914,928 1.4.1. Performing loans 6,880,723 1.4.2. Non-performing loans 215,083 1.4.3. Deferred loan payments (28,827) 1.4.4. Accrued interest receivables 73,272 1.4.5. Provision for loan impairment (225,323) 1.5. Derivative financial assets 224,646 1.6. Other financial assets 12,081 1.7. Other non-financial assets 134,676 1.8. Premises and equipments 604,688 1.9. Investment properties 6,586 1.10. Assets for sale 12,770 1.11. Intangible assets 24,952 Total assets 12,469,529 2. LIABILITIES 2.1. Current accounts 3,412,543 2.2. Savings 4,071,760 2.3. Due to other banks and financial institutions 2,358,337 2.4. Other funds 1,193,557 2.5. Other liabilities 221,893 Total liabilities 11,258,089 3. EQUITY 3.1. Share capital 202,164 3.2. Share premium 301,481 3.3. Treasury stock - 3.4. Revaluation surplus 6,666 3.5. Retained earnings 694,886 3.6. Other components of equity 6,242 Total equity 1,211,440 Total liabilities and equity 12,469,529 Off-balance items Contingencies and commitments (net) 1,407,017 PRUDENTIAL RATIOS BY THE BANK OF MONGOLIA
Ratios Requirement Actual Tier 1 capital ratio > 9%+4% conservation buffer 14.58% Capital adequacy ratio >12% 14.58% Liquidity ratio >25% 30.85% Single foreign currency open position ratio <±15% -4.50% Total foreign currency open position ratio <±30% -20.27% INCOME STATEMENT
2024/09/30 (In millions of MNT)
Income statement Items 1. Interest income 934,715 1.1. Balances with the Bank of Mongolia 13,789 1.2. Due from other banks and financial institutions 9,377 1.3. Investments in securities 144,404 1.4. Loans and advances to customers 658,212 1.5. Other 108,933 2. Interest expense 543,440 2.1. Current accounts 47,794 2.2. Savings 262,868 2.3. Borrowed funds 60,069 2.4. Securities 45,028 2.5. Other 127,681 3. Net interest income 391,275 4. Provision expenses - 5. Net interest income after provision 391,275 6. Other income 322,498 6.1. Non-interest income 308,219 6.1.1. Trading income 143,771 6.1.2. Gains from foreign currency exchange translation and valuation 35,819 6.1.3. Fees and commission income 91,232 6.1.4. Other non-interest income 37,398 6.2. Other income 14,279 7. Other expense 262,861 7.1. Non-interest expense 258,434 7.1.1. Other provision expense 12,884 7.1.2. Trading expense - 7.1.3. Losses from foreign currency exchange translation and valuation - 7.1.4. Fees and commission expense 56,164 7.1.5. Other operating expense 189,386 7.2. Other expense 4,426 8. Profit before tax 450,913 9. Income tax expense 102,719 10. Profit after tax 348,193 11. Other comprehensive income 587 12. Total comprehensive income 348,780 13. Earnings per share 430.6 UNAUDITED FINANCIAL STATEMENTS
2024/06/30 (In millions of MNT)
Balance sheet Items 1. ASSETS 1.1. Cash and cash equivalents 2,959,035 1.2. Deposits with other banks and financial institutions 850,629 1.3 Financial investments 1,071,816 1.3.1. Investments in subsidiary - 1.4. Loans and advances to customers (net) 6,419,161 1.4.1. Performing loans 6,395,819 1.4.2. Non-performing loans 214,545 1.4.3. Deferred loan payments (27,076) 1.4.4. Accrued interest receivables 57,843 1.4.5. Provision for loan impairment (221,970) 1.5. Derivative financial assets 245,923 1.6. Other financial assets 24,259 1.7. Other non-financial assets 60,218 1.8. Premises and equipments 593,129 1.9. Investment properties 6,586 1.10. Assets for sale 14,488 1.11. Intangible assets 26,416 Total assets 12,271,661 2. LIABILITIES 2.1. Current accounts 3,401,778 2.2. Savings 3,801,318 2.3. Due to other banks and financial institutions 2,343,467 2.4. Other funds 1,219,905 2.5. Other liabilities 368,809 Total liabilities 11,135,277 3. EQUITY 3.1. Share capital 202,164 3.2. Share premium 301,481 3.3. Treasury stock 3.4. Revaluation surplus 6,666 3.5. Retained earnings 620,185 3.6. Other components of equity 5,888 Total equity 1,136,384 Total liabilities and equity 12,271,661 Off-balance items Contingencies and commitments (net) 1,418,165 PRUDENTIAL RATIOS BY THE BANK OF MONGOLIA
Ratios Requirement Actual Tier 1 capital ratio > 9%+4% conservation buffer 14.45% Capital adequacy ratio >12% 14.45% Liquidity ratio >25% 33.67% Single foreign currency open position ratio <±15% -2.78% Total foreign currency open position ratio <±30% -10.05% INCOME STATEMENT
2024/06/30 (In millions of MNT)
Income statement Items 1. Interest income 580,080 1.1. Balances with the Bank of Mongolia 11,269 1.2. Due from other banks and financial institutions 6,405 1.3. Investments in securities 92,043 1.4. Loans and advances to customers 406,723 1.5. Other 63,641 2. Interest expense 322,525 2.1. Current accounts 32,146 2.2. Savings 165,659 2.3. Borrowed funds 39,796 2.4. Securities 14,051 2.5. Other 70,872 3. Net interest income 257,556 4. Provision expenses - 5. Net interest income after provision 257,556 6. Other income 270,584 6.1. Non-interest income 258,025 6.1.1. Trading income 134,374 6.1.2. Gains from foreign currency exchange translation and valuation 24,063 6.1.3. Fees and commission income 57,705 6.1.4. Other non-interest income 41,882 6.2. Other income 12,559 7. Other expense 170,510 7.1. Non-interest expense 166,986 7.1.1. Other provision expense 7,778 7.1.2. Trading expense - 7.1.3. Losses from foreign currency exchange translation and valuation - 7.1.4. Fees and commission expense 33,889 7.1.5. Other operating expense 125,319 7.2. Other expense 3,524 8. Profit before tax 357,629 9. Income tax expense 84,491 10. Profit after tax 273,138 11. Other comprehensive income 587 12. Total comprehensive income 273,724 13. Earnings per share 337.8 UNAUDITED FINANCIAL STATEMENTS
2024/03/31 (In millions of MNT)
Balance sheet Items 1. ASSETS 1.1. Cash and cash equivalents 2,233,246 1.2. Deposits with other banks and financial institutions 900,749 1.3 Financial investments 1,265,900 1.3.1. Investments in subsidiary - 1.4. Loans and advances to customers (net) 5,141,134 1.4.1. Performing loans 5,140,543 1.4.2. Non-performing loans 231,650 1.4.3. Deferred loan payments (22,118) 1.4.4. Accrued interest receivables 49,708 1.4.5. Provision for loan impairment (258,649) 1.5. Derivative financial assets 123,833 1.6. Other financial assets 23,420 1.7. Other non-financial assets 41,641 1.8. Premises and equipments 565,474 1.9. Investment properties 6,586 1.10. Assets for sale 14,829 1.11. Intangible assets 27,332 Total assets 10,344,145 2. LIABILITIES 2.1. Current accounts 3,819,138 2.2. Savings 3,648,085 2.3. Due to other banks and financial institutions 1,382,037 2.4. Other funds 256,411 2.5. Other liabilities 216,246 Total liabilities 9,321,918 3. EQUITY 3.1. Share capital 202,164 3.2. Share premium 301,481 3.3. Treasury stock 3.4. Revaluation surplus 6,666 3.5. Retained earnings 506,023 3.6. Other components of equity 5,893 Total equity 1,022,227 Total liabilities and equity 10,344,145 Off-balance items Contingencies and commitments (net) 1,398,585 PRUDENTIAL RATIOS BY THE BANK OF MONGOLIA
Ratios Requirement Actual Tier 1 capital ratio > 9%+4% conservation buffer 15.32% Capital adequacy ratio >12% 15.32% Liquidity ratio >25% 36.82% Single foreign currency open position ratio <±15% -6.07% Total foreign currency open position ratio <±30% -14.37% INCOME STATEMENT
2024/03/31 (In millions of MNT)
Income statement Items 1. Interest income 279,776 1.1. Balances with the Bank of Mongolia 7,059 1.2. Due from other banks and financial institutions 4,013 1.3. Investments in securities 50,763 1.4. Loans and advances to customers 185,918 1.5. Other 32,025 2. Interest expense 152,958 2.1. Current accounts 15,749 2.2. Savings 81,760 2.3. Borrowed funds 20,918 2.4. Securities - 2.5. Other 34,531 3. Net interest income 126,818 4. Provision expenses 5. Net interest income after provision 126,818 6. Other income 140,386 6.1. Non-interest income 133,138 6.1.1. Trading income 106,970 6.1.2. Gains from foreign currency exchange translation and valuation - 6.1.3. Fees and commission income 26,166 6.1.4. Other non-interest income 3 6.2. Other income 7,248 7. Other expense 155,928 7.1. Non-interest expense 155,305 7.1.1. Other provision expense 7,592 7.1.2. Trading expense - 7.1.3. Losses from foreign currency exchange translation and valuation 78,461 7.1.4. Fees and commission expense 14,410 7.1.5. Other operating expense 54,842 7.2. Other expense 623 8. Profit before tax 111,276 9. Income tax expense 25,080 10. Profit after tax 86,196 11. Other comprehensive income 587 12. Total comprehensive income 86,783
UNAUDITED FINANCIAL STATEMENTS
2023/12/31 (In millions of MNT)
Balance sheet Items 1. ASSETS 1.1. Cash and cash equivalents 3,613,556 1.2. Deposits with other banks and financial institutions 1,202,619 1.3 Financial investments 1,174,797 1.3.1. Investments in subsidiary - 1.4. Loans and advances to customers (net) 4,576,019 1.4.1. Performing loans 4,573,043 1.4.2. Non-performing loans 241,548 1.4.3. Deferred loan payments (20,888) 1.4.4. Accrued interest receivables 38,946 1.4.5. Provision for loan impairment (256,629) 1.5. Derivative financial assets 200,529 1.6. Other financial assets 24,313 1.7. Other non-financial assets 69,362 1.8. Premises and equipments 558,961 1.9. Investment properties 6,586 1.10. Assets for sale 21,545 1.11. Intangible assets 20,321 Total assets 11,468,609 2. LIABILITIES 2.1. Current accounts 3,979,432 2.2. Savings 3,745,458 2.3. Due to other banks and financial institutions 2,192,548 2.4. Other funds 379,593 2.5. Other liabilities 224,689 Total liabilities 10,521,720 3. EQUITY 3.1. Share capital 202,164 3.2. Share premium 301,481 3.3. Treasury stock 3.4. Revaluation surplus 6,666 3.5. Retained earnings 436,232 3.6. Other components of equity 345 Total equity 946,889 Total liabilities and equity 11,468,609 Off-balance items Contingencies and commitments (net) 1,355,125 PRUDENTIAL RATIOS BY THE BANK OF MONGOLIA
Ratios Requirement Actual Tier 1 capital ratio > 9%+4% conservation buffer 15.86% Capital adequacy ratio >12% 15.86% Liquidity ratio >25% 38.34% Single foreign currency open position ratio <±15% -0.98% Total foreign currency open position ratio <±30% -7.98% INCOME STATEMENT
2023/12/31 (In millions of MNT)
Income statement Items 1. Interest income 962,036 1.1. Balances with the Bank of Mongolia 22,962 1.2. Due from other banks and financial institutions 25,016 1.3. Investments in securities 175,446 1.4. Loans and advances to customers 586,245 1.5. Other 152,366 2. Interest expense 507,326 2.1. Current accounts 29,663 2.2. Savings 252,476 2.3. Borrowed funds 75,435 2.4. Securities - 2.5. Other 149,753 3. Net interest income 454,710 4. Provision expenses 3,374 5. Net interest income after provision 451,336 6. Other income 297,571 6.1. Non-interest income 284,529 6.1.1. Trading income 181,267 6.1.2. Gains from foreign currency exchange translation and valuation - 6.1.3. Fees and commission income 103,261 6.1.4. Other non-interest income - 6.2. Other income 13,043 7. Other expense 517,886 7.1. Non-interest expense 513,185 7.1.1. Other provision expense 18,992 7.1.2. Trading expense - 7.1.3. Losses from foreign currency exchange translation and valuation 237,627 7.1.4. Fees and commission expense 58,304 7.1.5. Other operating expense 198,261 7.2. Other expense 4,702 8. Profit before tax 231,020 9. Income tax expense 50,214 10. Profit after tax 180,807 11. Other comprehensive income 37,817 12. Total comprehensive income 218,624 UNAUDITED FINANCIAL STATEMENTS
2023/09/30 (In millions of MNT)
Balance sheet Items 1. ASSETS 1.1. Cash and cash equivalents 2,701,144 1.2. Deposits with other banks and financial institutions 1,153,449 1.3 Financial investments 838,439 1.3.1. Investments in subsidiary - 1.4. Loans and advances to customers (net) 4,095,085 1.4.1. Performing loans 4,082,177 1.4.2. Non-performing loans 263,774 1.4.3. Deferred loan payments (19,281) 1.4.4. Accrued interest receivables 35,781 1.4.5. Provision for loan impairment (267,366) 1.5. Derivative financial assets 251,461 1.6. Other financial assets 17,139 1.7. Other non-financial assets 33,170 1.8. Premises and equipments 509,862 1.9. Investment properties 6,586 1.10. Assets for sale 21,637 1.11. Intangible assets 19,959 Total assets 9,647,932 2. LIABILITIES 2.1. Current accounts 3,347,034 2.2. Savings 3,402,206 2.3. Due to other banks and financial institutions 1,597,806 2.4. Other funds 253,445 2.5. Other liabilities 150,912 Total liabilities 8,751,403 3. EQUITY 3.1. Share capital 202,164 3.2. Share premium 301,481 3.3. Treasury stock 3.4. Revaluation surplus 6,995 3.5. Retained earnings 385,543 3.6. Other components of equity 345 Total equity 896,529 Total liabilities and equity 9,647,932 Off-balance items Contingencies and commitments (net) 1,308,128 PRUDENTIAL RATIOS BY THE BANK OF MONGOLIA
Ratios Requirement Actual Tier 1 capital ratio > 9%+4% conservation buffer 16.40% Capital adequacy ratio >12% 16.40% Liquidity ratio >25% 39.02% Single foreign currency open position ratio <±15% -0.95% Total foreign currency open position ratio <±30% -3.13% INCOME STATEMENT
2023/09/30 (In millions of MNT)
Income statement Items 1. Interest income 704,751 1.1. Balances with the Bank of Mongolia 18,848 1.2. Due from other banks and financial institutions 18,068 1.3. Investments in securities 131,180 1.4. Loans and advances to customers 418,012 1.5. Other 118,643 2. Interest expense 369,977 2.1. Current accounts 17,376 2.2. Savings 177,502 2.3. Borrowed funds 57,163 2.4. Securities - 2.5. Other 117,936 3. Net interest income 334,774 4. Provision expenses 9,395 5. Net interest income after provision 325,379 6. Other income 254,989 6.1. Non-interest income 245,580 6.1.1. Trading income 169,755 6.1.2. Gains from foreign currency exchange translation and valuation - 6.1.3. Fees and commission income 75,825 6.1.4. Other non-interest income - 6.2. Other income 9,409 7. Other expense 415,832 7.1. Non-interest expense 413,481 7.1.1. Other provision expense 16,201 7.1.2. Trading expense - 7.1.3. Losses from foreign currency exchange translation and valuation 214,945 7.1.4. Fees and commission expense 42,028 7.1.5. Other operating expense 140,307 7.2. Other expense 2,351 8. Profit before tax 164,535 9. Income tax expense 34,089 10. Profit after tax 130,446 11. Other comprehensive income 37,817 12. Total comprehensive income 168,263 Net Profit - Quarterly net /MNT bln/

UNAUDITED FINANCIAL STATEMENTS
2023/06/30 (In millions of MNT)
Balance sheet Items 1. ASSETS 1.1. Cash and cash equivalents 1,940,939 1.2. Deposits with other banks and financial institutions 1,429,907 1.3 Financial investments 853,523 1.3.1. Investments in subsidiary - 1.4. Loans and advances to customers (net) 4,034,919 1.4.1. Performing loans 3,970,632 1.4.2. Non-performing loans 314,311 1.4.3. Deferred loan payments (19,133) 1.4.4. Accrued interest receivables 32,649 1.4.5. Provision for loan impairment (263,540) 1.5. Derivative financial assets 360,229 1.6. Other financial assets 14,884 1.7. Other non-financial assets 42,249 1.8. Premises and equipments 469,616 1.9. Investment properties 6,586 1.10. Assets for sale 13,475 1.11. Intangible assets 21,169 Total assets 9,187,497 2. LIABILITIES 2.1. Current accounts 2,928,038 2.2. Savings 3,116,731 2.3. Due to other banks and financial institutions 1,894,632 2.4. Other funds 277,255 2.5. Other liabilities 124,505 Total liabilities 8,341,162 3. EQUITY 3.1. Share capital 202,164 3.2. Share premium 301,481 3.3. Treasury stock 3.4. Revaluation surplus 6,995 3.5. Retained earnings 333,333 3.6. Other components of equity 2,362 Total equity 846,335 Total liabilities and equity 9,187,497 Off-balance items Contingencies and commitments (net) 1,183,877 PRUDENTIAL RATIOS BY THE BANK OF MONGOLIA
Ratios Requirement Actual Tier 1 capital ratio > 9%+4% conservation buffer 16.30% Capital adequacy ratio >12% 16.30% Liquidity ratio >25% 33.33% Single foreign currency open position ratio <±15% -8.12% Total foreign currency open position ratio <±30% -18.75% INCOME STATEMENT
2023/06/30 (In millions of MNT)
Income statement Items 1. Interest income 448,841 1.1. Balances with the Bank of Mongolia 12,818 1.2. Due from other banks and financial institutions 12,037 1.3. Investments in securities 85,579 1.4. Loans and advances to customers 261,710 1.5. Other 76,697 2. Interest expense 235,370 2.1. Current accounts 8,735 2.2. Savings 110,844 2.3. Borrowed funds 38,090 2.4. Securities - 2.5. Other 77,702 3. Net interest income 213,471 4. Provision expenses 5,609 5. Net interest income after provision 207,862 6. Other income 109,627 6.1. Non-interest income 101,855 6.1.1. Trading income 53,034 6.1.2. Gains from foreign currency exchange translation and valuation - 6.1.3. Fees and commission income 48,821 6.1.4. Other non-interest income - 6.2. Other income 7,771 7. Other expense 221,385 7.1. Non-interest expense 219,878 7.1.1. Other provision expense 14,507 7.1.2. Trading expense - 7.1.3. Losses from foreign currency exchange translation and valuation 86,442 7.1.4. Fees and commission expense 26,371 7.1.5. Other operating expense 92,557 7.2. Other expense 1,508 8. Profit before tax 96,104 9. Income tax expense 17,868 10. Profit after tax 78,236 11. Other comprehensive income 39,828 12. Total comprehensive income 118,064 Net Profit - Quarterly net /MNT bln/
UNAUDITED FINANCIAL STATEMENTS
2023/03/31 (In millions of MNT)
Balance sheet Items 1. ASSETS 1.1. Cash and cash equivalents 2,187,943 1.2. Deposits with other banks and financial institutions 1,470,565 1.3 Financial investments 831,239 1.3.1. Investments in subsidiary - 1.4. Loans and advances to customers (net) 3,650,801 1.4.1. Performing loans 3,578,677 1.4.2. Non-performing loans 331,940 1.4.3. Deferred loan payments (16,392) 1.4.4. Accrued interest receivables 33,015 1.4.5. Provision for loan impairment (276,440) 1.5. Derivative financial assets 440,821 1.6. Other financial assets 14,540 1.7. Other non-financial assets 57,777 1.8. Premises and equipments 385,444 1.9. Investment properties 6,586 1.10. Assets for sale 13,040 1.11. Intangible assets 21,234 Total assets 9,079,991 2. LIABILITIES 2.1. Current accounts 2,727,437 2.2. Savings 3,060,277 2.3. Due to other banks and financial institutions 2,003,556 2.4. Other funds 312,107 2.5. Other liabilities 99,215 Total liabilities 8,202,592 3. EQUITY 3.1. Share capital 202,164 3.2. Share premium 301,481 3.3. Treasury stock 3.4. Revaluation surplus 6,995 3.5. Retained earnings 341,636 3.6. Other components of equity 25,123 Total equity 877,399 Total liabilities and equity 9,079,991 Off-balance items Contingencies and commitments (net) 1,108,895 PRUDENTIAL RATIOS BY THE BANK OF MONGOLIA
Ratios Requirement Actual Tier 1 capital ratio > 9%+4% conservation buffer 17.49% Capital adequacy ratio >12% 17.49% Liquidity ratio >25% 36.66% Single foreign currency open position ratio <±15% 6.55% Total foreign currency open position ratio <±30% 18.05% INCOME STATEMENT
2023/03/31 (In millions of MNT)
Income statement Items 1. Interest income 214,378 1.1. Balances with the Bank of Mongolia 6,238 1.2. Due from other banks and financial institutions 5,247 1.3. Investments in securities 39,872 1.4. Loans and advances to customers 126,180 1.5. Other 36,841 2. Interest expense 110,226 2.1. Current accounts 2,174 2.2. Savings 52,071 2.3. Borrowed funds 18,841 2.4. Securities - 2.5. Other 37,140 3. Net interest income 104,152 4. Provision expenses 21,069 5. Net interest income after provision 83,082 6. Other income 52,639 6.1. Non-interest income 50,094 6.1.1. Trading income 27,084 6.1.2. Gains from foreign currency exchange translation and valuation - 6.1.3. Fees and commission income 22,847 6.1.4. Other non-interest income 163 6.2. Other income 2,545 7. Other expense 93,326 7.1. Non-interest expense 92,346 7.1.1. Other provision expense 20,373 7.1.2. Trading expense - 7.1.3. Losses from foreign currency exchange translation and valuation 16,134 7.1.4. Fees and commission expense 12,714 7.1.5. Other operating expense 43,125 7.2. Other expense 980 8. Profit before tax 42,395 9. Income tax expense 8,733 10. Profit after tax 33,662 11. Other comprehensive income - 12. Total comprehensive income 33,662
UNAUDITED FINANCIAL STATEMENTS
2022/12/31 (In millions of MNT)
Balance sheet Items 1. ASSETS 1.1. Cash and cash equivalents 2,238,431 1.2. Deposits with other banks and financial institutions 1,438,754 1.3 Financial investments 699,100 1.3.1. Investments in subsidiary - 1.4. Loans and advances to customers (net) 3,607,754 1.4.1. Performing loans 3,583,982 1.4.2. Non-performing loans 264,903 1.4.3. Deferred loan payments (16,848) 1.4.4. Accrued interest receivables 30,970 1.4.5. Provision for loan impairment (255,253) 1.5. Derivative financial assets 426,319 1.6. Other financial assets 13,816 1.7. Other non-financial assets 79,949 1.8. Premises and equipments 385,210 1.9. Investment properties 6,586 1.10. Assets for sale 6,825 1.11. Intangible assets 22,496 Total assets 8,925,239 2. LIABILITIES 2.1. Current accounts 2,702,834 2.2. Savings 2,917,008 2.3. Due to other banks and financial institutions 1,999,230 2.4. Other funds 306,165 2.5. Other liabilities 156,264 Total liabilities 8,081,502 3. EQUITY 3.1. Share capital 202,164 3.2. Share premium 301,481 3.3. Treasury stock 3.4. Revaluation surplus 6,995 3.5. Retained earnings 307,974 3.6. Other components of equity 25,123 Total equity 843,737 Total liabilities and equity 8,925,239 Off-balance items Contingencies and commitments (net) 1,171,897 PRUDENTIAL RATIOS BY THE BANK OF MONGOLIA
Ratios Requirement Actual Tier 1 capital ratio > 9%+4% conservation buffer 17.65% Capital adequacy ratio >12% 17.65% Liquidity ratio >25% 36.29% Single foreign currency open position ratio <±15% 8.00% Total foreign currency open position ratio <±30% 10.75% INCOME STATEMENT
2022/12/31 (In millions of MNT)
Income statement Items 1. Interest income 669,457 1.1. Balances with the Bank of Mongolia 20,131 1.2. Due from other banks and financial institutions 22,923 1.3. Investments in securities 98,909 1.4. Loans and advances to customers 437,195 1.5. Other 90,299 2. Interest expense 307,854 2.1. Current accounts - 2.2. Savings 163,359 2.3. Borrowed funds 53,562 2.4. Securities - 2.5. Other 90,934 3. Net interest income 361,603 4. Provision expenses 102,698 5. Net interest income after provision 258,905 6. Other income 205,982 6.1. Non-interest income 190,776 6.1.1. Trading income 69,169 6.1.2. Gains from foreign currency exchange translation and valuation 31,246 6.1.3. Fees and commission income 85,083 6.1.4. Other non-interest income 5,279 6.2. Other income 15,205 7. Other expense 310,883 7.1. Non-interest expense 300,271 7.1.1. Other provision expense 89,853 7.1.2. Trading expense - 7.1.3. Losses from foreign currency exchange translation and valuation - 7.1.4. Fees and commission expense 44,502 7.1.5. Other operating expense 165,916 7.2. Other expense 10,612 8. Profit before tax 154,004 9. Income tax expense 53,530 10. Profit after tax 100,474 11. Other comprehensive income 348 12. Total comprehensive income 100,821 UNAUDITED FINANCIAL STATEMENTS
2022/09/30 (In millions of MNT)
Balance sheet Items 1. ASSETS 1.1. Cash and cash equivalents 1,996,575 1.2. Deposits with other banks and financial institutions 1,364,962 1.3 Financial investments 538,730 1.3.1. Investments in subsidiary - 1.4. Loans and advances to customers (net) 3,674,118 1.4.1. Performing loans 3,572,766 1.4.2. Non-performing loans 295,235 1.4.3. Deferred loan payments (15,337) 1.4.4. Accrued interest receivables 29,920 1.4.5. Provision for loan impairment (208,466) 1.5. Derivative financial assets 347,610 1.6. Other financial assets 37,730 1.7. Other non-financial assets 88,453 1.8. Premises and equipments 383,451 1.9. Investment properties 7,225 1.10. Assets for sale 7,096 1.11. Intangible assets 20,566 Total assets 8,466,516 2. LIABILITIES 2.1. Current accounts 2,442,840 2.2. Savings 3,083,999 2.3. Due to other banks and financial institutions 1,824,542 2.4. Other funds 304,092 2.5. Other liabilities 106,028 Total liabilities 7,761,501 3. EQUITY 3.1. Share capital 179,049 3.2. Share premium 205,782 3.3. Treasury stock 3.4. Revaluation surplus 7,245 3.5. Retained earnings 261,404 3.6. Other components of equity 51,536 Total equity 705,015 Total liabilities and equity 8,466,516 Off-balance items Contingencies and commitments (net) 1,066,218 PRUDENTIAL RATIOS BY THE BANK OF MONGOLIA
Ratios Requirement Actual Tier 1 capital ratio > 9%+4% conservation buffer 14.18% Capital adequacy ratio >12% 14.18% Liquidity ratio >25% 34.67% Single foreign currency open position ratio <±15% -1.35% Total foreign currency open position ratio <±30% -3.74% INCOME STATEMENT
2022/09/30 (In millions of MNT)
Income statement Items 1. Interest income 480,937 1.1. Balances with the Bank of Mongolia 13,210 1.2. Due from other banks and financial institutions 16,627 1.3. Investments in securities 75,579 1.4. Loans and advances to customers 317,224 1.5. Other 58,298 2. Interest expense 218,521 2.1. Current accounts - 2.2. Savings 119,613 2.3. Borrowed funds 38,086 2.4. Securities - 2.5. Other 60,822 3. Net interest income 262,416 4. Provision expenses 52,632 5. Net interest income after provision 209,784 6. Other income 132,209 6.1. Non-interest income 120,742 6.1.1. Trading income 53,558 6.1.2. Gains from foreign currency exchange translation and valuation 6.1.3. Fees and commission income 62,504 6.1.4. Other non-interest income 4,680 6.2. Other income 11,467 7. Other expense 235,790 7.1. Non-interest expense 226,844 7.1.1. Other provision expense 53,062 7.1.2. Trading expense - 7.1.3. Losses from foreign currency exchange translation and valuation 26,809 7.1.4. Fees and commission expense 31,377 7.1.5. Other operating expense 115,596 7.2. Other expense 8,946 8. Profit before tax 106,204 9. Income tax expense 27,740 10. Profit after tax 78,464 11. Other comprehensive income 348 12. Total comprehensive income 78,811 UNAUDITED FINANCIAL STATEMENTS
2022/06/30 (In millions of MNT)
Balance sheet Items 1. ASSETS 1.1. Cash and cash equivalents 2,324,799 1.2. Deposits with other banks and financial institutions 1,311,841 1.3 Financial investments 493,750 1.3.1. Investments in subsidiary - 1.4. Loans and advances to customers (net) 3,537,989 1.4.1. Performing loans 3,425,202 1.4.2. Non-performing loans 266,330 1.4.3. Deferred loan payments (15,106) 1.4.4. Accrued interest receivables 41,475 1.4.5. Provision for loan impairment (179,912) 1.5. Derivative financial assets 295,002 1.6. Other financial assets 51,247 1.7. Other non-financial assets 101,016 1.8. Premises and equipments 386,535 1.9. Investment properties 1,158 1.10. Assets for sale 54,945 1.11. Intangible assets 16,468 Total assets 8,574,750 2. LIABILITIES 2.1. Current accounts 2,037,943 2.2. Savings 3,579,697 2.3. Due to other banks and financial institutions 1,742,943 2.4. Other funds 353,269 2.5. Other liabilities 145,925 Total liabilities 7,859,778 3. EQUITY 3.1. Share capital 204,827 3.2. Share premium 205,782 3.3. Treasury stock (9,391) 3.4. Revaluation surplus 7,245 3.5. Retained earnings 240,257 3.6. Other components of equity 66,252 Total equity 714,972 Total liabilities and equity 8,574,750 Off-balance items Contingencies and commitments (net) 1,329,056 PRUDENTIAL RATIOS BY THE BANK OF MONGOLIA
Ratios Requirement Actual Tier 1 capital ratio > 9% 14.03% Capital adequacy ratio >12% 14.40% Liquidity ratio >25% 38.32% Single foreign currency open position ratio <±15% 5.37% Total foreign currency open position ratio <±30% 7.61% INCOME STATEMENT
2022/06/30 (In millions of MNT)
Income statement Items 1. Interest income 308,965 1.1. Balances with the Bank of Mongolia 7,585 1.2. Due from other banks and financial institutions 10,880 1.3. Investments in securities 52,483 1.4. Loans and advances to customers 203,170 1.5. Other 34,846 2. Interest expense 142,622 2.1. Customer accounts - 2.2. Savings 81,786 2.3. Borrowed funds 24,043 2.4. Securities - 2.5. Other 36,793 3. Net interest income 166,343 4. Provision expenses 24,462 5. Net interest income after provision 141,881 6. Other income 80,764 6.1. Non-interest income 77,112 6.1.1. Gains from trading in foreign currencies 33,172 6.1.2. Gains from foreign currency exchange translation 6.1.3. Fees and commission income 40,514 6.1.4. Other non-interest income 3,425 6.2. Other income 3,653 7. Other expense 139,524 7.1. Non-interest expense 131,148 7.1.1. Other provision expense 26,844 7.1.2. Losses from trading in foreign currencies - 7.1.3. Losses from foreign currency exchange translation 7,129 7.1.4. Fees and commission expense 20,392 7.1.5. Other operating expense 76,783 7.2. Other expense 8,376 8. Profit before tax 83,121 9. Income tax expense 25,822 10. Profit after tax 57,300 11. Other comprehensive income 348 12. Total comprehensive income 57,647 UNAUDITED FINANCIAL STATEMENTS
2022/03/31 (In millions of MNT)
Balance sheet Items 1. ASSETS 1.1. Cash and cash equivalents 2,119,438 1.2. Deposits with other banks and financial institutions 1,232,180 1.3 Financial investments 476,365 1.3.1. Investments in subsidiary - 1.4. Loans and advances to customers (net) 3,301,996 1.4.1. Performing loans 3,169,012 1.4.2. Non-performing loans 305,717 1.4.3. Deferred loan payments (13,385) 1.4.4. Accrued interest receivables 34,627 1.4.5. Provision for loan impairment (193,975) 1.5. Derivative financial assets 232,801 1.6. Other financial assets 94,225 1.7. Other non-financial assets 47,430 1.8. Premises and equipments 251,493 1.9. Investment properties 1,158 1.10. Assets for sale 58,439 1.11. Intangible assets 17,438 Total assets 7,832,962 2. LIABILITIES 2.1. Current accounts 1,996,937 2.2. Savings 3,169,294 2.3. Due to other banks and financial institutions 1,653,695 2.4. Other funds 324,686 2.5. Other liabilities 56,695 Total liabilities 7,201,306 3. EQUITY 3.1. Share capital 194,739 3.2. Share premium 165,365 3.3. Treasury stock (9,713) 3.4. Revaluation surplus 7,245 3.5. Retained earnings 186,438 3.6. Other components of equity 87,582 Total equity 631,656 Total liabilities and equity 7,832,962 Off-balance items Contingencies and commitments (net) 1,088,419 PRUDENTIAL RATIOS BY THE BANK OF MONGOLIA
Ratios Requirement Actual Tier 1 capital ratio > 9% 12.54% Capital adequacy ratio >12% 12.83% Liquidity ratio >25% 36.86% Single foreign currency open position ratio <±15% 1.74% Total foreign currency open position ratio <±30% 4.14% INCOME STATEMENT
2022/03/31 (In millions of MNT)
Income statement Items 1. Interest income 139,101 1.1. Balances with the Bank of Mongolia 2,243 1.2. Due from other banks and financial institutions 4,856 1.3. Investments in securities 27,867 1.4. Loans and advances to customers 89,103 1.5. Other 15,031 2. Interest expense 69,859 2.1. Customer accounts - 2.2. Savings 43,324 2.3. Borrowed funds 11,195 2.4. Securities - 2.5. Other 15,340 3. Net interest income 69,242 4. Provision expenses 18,071 5. Net interest income after provision 51,171 6. Other income 50,056 6.1. Non-interest income 48,037 6.1.1. Gains from trading in foreign currencies 15,102 6.1.2. Gains from foreign currency exchange translation 14,567 6.1.3. Fees and commission income 18,368 6.1.4. Other non-interest income 1 6.2. Other income 2,018 7. Other expense 64,324 7.1. Non-interest expense 60,525 7.1.1. Other provision expense 18,749 7.1.2. Losses from trading in foreign currencies - 7.1.3. Losses from foreign currency exchange translation 7.1.4. Fees and commission expense 8,279 7.1.5. Other operating expense 33,496 7.2. Other expense 3,799 8. Profit before tax 36,903 9. Income tax expense 14,102 10. Profit after tax 22,801 11. Other comprehensive income (177) 12. Total comprehensive income 22,624
UNAUDITED FINANCIAL STATEMENTS
2021/12/31 (In millions of MNT)
Balance sheet Items 1. ASSETS 1.1. Cash and cash equivalents 2,378,377 1.2. Deposits with other banks and financial institutions 1,157,002 1.3 Financial investments 494,593 1.3.1. Investments in subsidiary - 1.4. Loans and advances to customers (net) 3,261,525 1.4.1. Performing loans 3,161,031 1.4.2. Non-performing loans 259,863 1.4.3. Deferred loan payments (13,227) 1.4.4. Accrued interest receivables 42,247 1.4.5. Provision for loan impairment (188,389) 1.5. Derivative financial assets 186,705 1.6. Other financial assets 94,513 1.7. Other non-financial assets 85,718 1.8. Premises and equipments 151,044 1.9. Investment properties 1,158 1.10. Assets for sale 71,054 1.11. Intangible assets 18,855 Total assets 7,900,543 2. LIABILITIES 2.1. Current accounts 1,764,233 2.2. Savings 3,570,795 2.3. Due to other banks and financial institutions 1,509,422 2.4. Other funds 370,194 2.5. Other liabilities 89,866 Total liabilities 7,304,510 3. EQUITY 3.1. Share capital 194,739 3.2. Share premium 165,365 3.3. Treasury stock (9,713) 3.4. Revaluation surplus 7,245 3.5. Retained earnings 191,516 3.6. Other components of equity 46,881 Total equity 596,033 Total liabilities and equity 7,900,543 Off-balance items Contingencies and commitments (net) 1,080,040 PRUDENTIAL RATIOS BY THE BANK OF MONGOLIA
Ratios Requirement Actual Tier 1 capital ratio > 9% 12.98% Capital adequacy ratio >12% 13.28% Liquidity ratio >25% 41.30% Single foreign currency open position ratio <±15% 11.98% Total foreign currency open position ratio <±30% 15.11% INCOME STATEMENT
2021/12/31 (In millions of MNT)
Income statement Items 1. Interest income 576,070 1.1. Balances with the Bank of Mongolia 8,343 1.2. Due from other banks and financial institutions 21,179 1.3. Investments in securities 99,447 1.4. Loans and advances to customers 387,663 1.5. Other 59,437 2. Interest expense 330,505 2.1. Customer accounts - 2.2. Savings 223,073 2.3. Borrowed funds 40,071 2.4. Securities - 2.5. Other 67,362 3. Net interest income 245,564 4. Provision expenses 36,725 5. Net interest income after provision 208,840 6. Other income 98,307 6.1. Non-interest income 88,312 6.1.1. Gains from trading in foreign currencies 25,134 6.1.2. Gains from foreign currency exchange translation 6.1.3. Fees and commission income 62,969 6.1.4. Other non-interest income 209 6.2. Other income 9,995 7. Other expense 273,916 7.1. Non-interest expense 261,596 7.1.1. Other provision expense 84,573 7.1.2. Losses from trading in foreign currencies - 7.1.3. Losses from foreign currency exchange translation 17,868 7.1.4. Fees and commission expense 24,635 7.1.5. Other operating expense 134,520 7.2. Other expense 12,321 8. Profit before tax 33,230 9. Income tax expense 11,134 10. Profit after tax 22,096 11. Other comprehensive income 865 12. Total comprehensive income 22,961 LOANS AND OTHER EQUIVALENT ASSETS PROVIDED TO RELATED PARTIES OF THE BANK
2021/12/31 (In millions of MNT)
Related parties Category of assets Balance Share to capital 1. Loans and other equivalent asset provided to a related party (less than 5% of capital) 1.1. Shareholders of the Bank - - - 1.2. Key management personnel - - - 1.3. Other related parties Receivable, Guarantee 6,259 1.14% 2. Total Loans and other equivalent asset provided to related parties (less than 20% of capital) 2.1. Shareholders of the Bank Loan,Credit line 498 0.09% 2.2. Key management personnel Loan, Credit line, Guarantee 6,434 1.18% 2.3. Other related parties Loan,Guarantee, Receivable, Shares, Credit line 8,257 1.51% UNAUDITED FINANCIAL STATEMENTS
2021/09/30 (In millions of MNT)
Balance sheet Items 1. ASSETS 1.1. Cash and cash equivalents 1,893,695 1.2. Deposits with other banks and financial institutions 1,129,212 1.3 Financial investments 457,905 1.3.1. Investments in subsidiary - 1.4. Loans and advances to customers (net) 3,386,643 1.4.1. Performing loans 3,296,529 1.4.2. Non-performing loans 253,840 1.4.3. Deferred loan payments (12,987) 1.4.4. Accrued interest receivables 42,308 1.4.5. Provision for loan impairment (193,048) 1.5. Derivative financial assets 193,661 1.6. Other financial assets 134,285 1.7. Other non-financial assets 162,707 1.8. Premises and equipments 151,685 1.9. Investment properties 1,158 1.10. Assets for sale 68,363 1.11. Intangible assets 16,809 Total assets 7,596,123 2. LIABILITIES 2.1. Current accounts 1,491,493 2.2. Savings 3,590,889 2.3. Due to other banks and financial institutions 1,526,386 2.4. Other funds 313,844 2.5. Other liabilities 81,829 Total liabilities 7,004,442 3. EQUITY 3.1. Share capital 194,739 3.2. Share premium 165,365 3.3. Treasury stock (9,713) 3.4. Revaluation surplus 7,496 3.5. Retained earnings 165,484 3.6. Other components of equity 68,310 Total equity 591,681 Total liabilities and equity 7,596,123 Off-balance items Contingencies and commitments (net) 897,583 PRUDENTIAL RATIOS BY THE BANK OF MONGOLIA
Ratios Requirement Actual Tier 1 capital ratio > 9% 12.20% Capital adequacy ratio >12% 12.50% Liquidity ratio >25% 35.13% Single foreign currency open position ratio <±15% 8.88% Total foreign currency open position ratio <±30% 17.54% INCOME STATEMENT
2021/09/30 (In millions of MNT)
Income statement Items 1. Interest income 426,418 1.1. Balances with the Bank of Mongolia 5,717 1.2. Due from other banks and financial institutions 15,950 1.3. Investments in securities 73,524 1.4. Loans and advances to customers 287,015 1.5. Other 44,213 2. Interest expense 258,082 2.1. Customer accounts - 2.2. Savings 175,567 2.3. Borrowed funds 29,926 2.4. Securities - 2.5. Other 52,588 3. Net interest income 168,336 4. Provision expenses 41,732 5. Net interest income after provision 126,604 6. Other income 70,603 6.1. Non-interest income 62,446 6.1.1. Gains from trading in foreign currencies 18,685 6.1.2. Gains from foreign currency exchange translation 6.1.3. Fees and commission income 43,732 6.1.4. Other non-interest income 29 6.2. Other income 8,157 7. Other expense 174,161 7.1. Non-interest expense 165,149 7.1.1. Other provision expense 44,571 7.1.2. Losses from trading in foreign currencies - 7.1.3. Losses from foreign currency exchange translation 9,681 7.1.4. Fees and commission expense 16,796 7.1.5. Other operating expense 94,101 7.2. Other expense 9,012 8. Profit before tax 23,047 9. Income tax expense 5,332 10. Profit after tax 17,715 11. Other comprehensive income 894 12. Total comprehensive income 18,609 LOANS AND OTHER EQUIVALENT ASSETS PROVIDED TO RELATED PARTIES OF THE BANK
2021/09/30 (In millions of MNT)
Related parties Category of assets Balance Share to capital 1. Loans and other equivalent asset provided to a related party (less than 5% of capital) 1.1. Shareholders of the Bank - - - 1.2. Key management personnel - - - 1.3. Other related parties Receivable 22,110 4.24% 2. Total Loans and other equivalent asset provided to related parties (less than 20% of capital) 2.1. Shareholders of the Bank Loan,Credit line, Receivable 22,749 4.37% 2.2. Key management personnel Loan, Credit line, Guarantee 7,504 1.44% 2.3. Other related parties Loan, Guarantee, Receivable, Shares, Credit line 12,743 2.45% UNAUDITED FINANCIAL STATEMENTS
2021/06/30 (In millions of MNT)
Balance sheet Items 1. ASSETS 1.1. Cash and cash equivalents 2,252,934 1.2. Deposits with other banks and financial institutions 1,255,181 1.3 Financial investments 450,377 1.3.1. Investments in subsidiary - 1.4. Loans and advances to customers (net) 3,129,555 1.4.1. Performing loans 3,028,843 1.4.2. Non-performing loans 268,627 1.4.3. Deferred loan payments (11,911) 1.4.4. Accrued interest receivables 46,491 1.4.5. Provision for loan impairment (202,495) 1.5. Derivative financial assets 206,353 1.6. Other financial assets 139,785 1.7. Other non-financial assets 133,863 1.8. Premises and equipments 151,250 1.9. Investment properties 23,165 1.10. Assets for sale 59,149 1.11. Intangible assets 16,722 Total assets 7,818,335 2. LIABILITIES 2.1. Current accounts 1,826,009 2.2. Savings 3,656,459 2.3. Due to other banks and financial institutions 1,371,734 2.4. Other funds 252,205 2.5. Other liabilities 129,555 Total liabilities 7,235,961 3. EQUITY 3.1. Share capital 68,019 3.2. Share premium 291,844 3.3. Treasury stock (9,471) 3.4. Revaluation surplus 7,496 3.5. Retained earnings 172,440 3.6. Other components of equity 52,047 Total equity 582,374 Total liabilities and equity 7,818,335 Off-balance items Contingencies and commitments (net) 920,557 PRUDENTIAL RATIOS BY THE BANK OF MONGOLIA
Ratios Requirement Actual Tier 1 capital ratio > 9% 12.35% Capital adequacy ratio >12% 12.65% Liquidity ratio >20% 40.35% Single foreign currency open position ratio <±15% 2.29% Total foreign currency open position ratio <±30% 4.27% INCOME STATEMENT
2021/06/30 (In millions of MNT)
Income statement Items 1. Interest income 277,276 1.1. Balances with the Bank of Mongolia 4,124 1.2. Due from other banks and financial institutions 10,256 1.3. Investments in securities 47,378 1.4. Loans and advances to customers 186,329 1.5. Other 29,187 2. Interest expense 179,042 2.1. Customer accounts - 2.2. Savings 122,917 2.3. Borrowed funds 19,385 2.4. Securities - 2.5. Other 36,740 3. Net interest income 98,233 4. Provision expenses 36,241 5. Net interest income after provision 61,992 6. Other income 51,747 6.1. Non-interest income 38,888 6.1.1. Gains from trading in foreign currencies 11,314 6.1.2. Gains from foreign currency exchange translation 679 6.1.3. Fees and commission income 26,868 6.1.4. Other non-interest income 27 6.2. Other income 12,859 7. Other expense 103,507 7.1. Non-interest expense 95,507 7.1.1. Other provision expense 24,476 7.1.2. Losses from trading in foreign currencies - 7.1.3. Losses from foreign currency exchange translation - 7.1.4. Fees and commission expense 10,416 7.1.5. Other operating expense 60,615 7.2. Other expense 8,000 8. Profit before tax 10,233 9. Income tax expense 1,773 10. Profit after tax 8,460 11. Other comprehensive income 842 12. Total comprehensive income 9,302 LOANS AND OTHER EQUIVALENT ASSETS PROVIDED TO RELATED PARTIES OF THE BANK
2021/06/30 (In millions of MNT)
Related parties Category of assets Balance Share to capital 1. Loans and other equivalent asset provided to a related party (less than 5% of capital) 1.1. Shareholders of the Bank - - - 1.2. Key management personnel - - - 1.3. Other related parties Receivable 21,954 4.16% 2. Total Loans and other equivalent asset provided to related parties (less than 20% of capital) 2.1. Shareholders of the Bank Loan,Credit line, Receivable 22,308 4.22% 2.2. Key management personnel Loan, Credit line, Guarantee 6,128 1.16% 2.3. Other related parties Loan, Credit line,Shares, Guarantee, Receivable 13,878 2.63% UNAUDITED FINANCIAL STATEMENTS
2021/03/31 (In millions of MNT)
Balance sheet Items 1. ASSETS 1.1. Cash and cash equivalents 1,954,909 1.2. Deposits with other banks and financial institutions 1,231,736 1.3 Financial investments 327,248 1.3.1. Investments in subsidiary - 1.4. Loans and advances to customers (net) 3,033,802 1.4.1. Performing loans 2,897,878 1.4.2. Non-performing loans 279,352 1.4.3. Deferred loan payments (8,059) 1.4.4. Accrued interest receivables 80,996 1.4.5. Provision for loan impairment (216,365) 1.5. Derivative financial assets 207,990 1.6. Other financial assets 162,159 1.7. Other non-financial assets 91,526 1.8. Premises and equipments 149,175 1.9. Investment properties 30,621 1.10. Assets for sale 47,651 1.11. Intangible assets 17,163 Total assets 7,253,980 2. LIABILITIES 2.1. Current accounts 1,450,169 2.2. Savings 3,663,597 2.3. Due to other banks and financial institutions 1,277,940 2.4. Other funds 182,334 2.5. Other liabilities 92,740 Total liabilities 6,666,779 3. EQUITY 3.1. Share capital 68,019 3.2. Share premium 291,844 3.3. Treasury stock (9,471) 3.4. Revaluation surplus 7,496 3.5. Retained earnings 187,991 3.6. Other components of equity 41,323 Total equity 587,201 Total liabilities and equity 7,253,980 Off-balance items Contingencies and commitments (net) 813,276 PRUDENTIAL RATIOS BY THE BANK OF MONGOLIA
Ratios Requirement Actual Tier 1 capital ratio > 9% 12.78% Capital adequacy ratio >12% 13.07% Liquidity ratio >20% 38.16% Single foreign currency open position ratio <±15% 7.78% Total foreign currency open position ratio <±30% 9.60% INCOME STATEMENT
2021/03/31 (In millions of MNT)
Income statement Items 1. Interest income 144,135 1.1. Balances with the Bank of Mongolia 1,854 1.2. Due from other banks and financial institutions 5,060 1.3. Investments in securities 22,399 1.4. Loans and advances to customers 100,054 1.5. Other 14,769 2. Interest expense 94,396 2.1. Customer accounts - 2.2. Savings 64,827 2.3. Borrowed funds 9,653 2.4. Securities - 2.5. Other 19,915 3. Net interest income 49,739 4. Provision expenses 30,497 5. Net interest income after provision 19,242 6. Other income 21,124 6.1. Non-interest income 20,688 6.1.1. Gains from trading in foreign currencies 5,526 6.1.2. Gains from foreign currency exchange translation 2,388 6.1.3. Fees and commission income 12,772 6.1.4. Other non-interest income 1 6.2. Other income 437 7. Other expense 37,723 7.1. Non-interest expense 37,555 7.1.1. Other provision expense 4,203 7.1.2. Losses from trading in foreign currencies - 7.1.3. Losses from foreign currency exchange translation - 7.1.4. Fees and commission expense 4,912 7.1.5. Other operating expense 28,440 7.2. Other expense 168 8. Profit before tax 2,643 9. Income tax expense 47 10. Profit after tax 2,596 11. Other comprehensive income 853 12. Total comprehensive income 3,449 LOANS AND OTHER EQUIVALENT ASSETS PROVIDED TO RELATED PARTIES OF THE BANK
2021/03/31 (In millions of MNT)
Related parties Category of assets Balance Share to capital 1. Loans and other equivalent asset provided to a related party (less than 5% of capital) 1.1. Shareholders of the Bank - - - 1.2. Key management personnel - - - 1.3. Other related parties Receivable 22,667 4.17% 2. Total Loans and other equivalent asset provided to related parties (less than 20% of capital) 2.1. Shareholders of the Bank Loan,Credit line, Receivable 23,164 4.26% 2.2. Key management personnel Loan, Credit line, Guarantee 3,222 0.59% 2.3. Other related parties Loan, Guarantee, Receivable 26,107 4.80%
AUDITED FINANCIAL STATEMENTS
2020/12/31 (In millions of MNT)
Balance sheet Items 1. ASSETS 1.1. Cash and cash equivalents 1,947,425 1.2. Deposits with other banks and financial institutions 1,228,007 1.3 Financial investments 296,326 1.3.1. Investments in subsidiary - 1.4. Loans and advances to customers (net) 3,031,346 1.4.1. Performing loans 2,828,394 1.4.2. Non-performing loans 256,745 1.4.3. Deferred loan payments (9,132) 1.4.4. Accrued interest receivables 115,462 1.4.5. Provision for loan impairment (160,125) 1.5. Derivative financial assets 205,615 1.6. Other financial assets 155,377 1.7. Other non-financial assets 182,702 1.8. Premises and equipments 146,499 1.9. Investment properties 39,672 1.10. Assets for sale 26,984 1.11. Intangible assets 18,038 Total assets 7,277,990 2. LIABILITIES 2.1. Current accounts 1,411,155 2.2. Savings 3,648,052 2.3. Due to other banks and financial institutions 1,287,016 2.4. Other funds 177,974 2.5. Other liabilities 122,235 Total liabilities 6,646,432 3. EQUITY 3.1. Share capital 68,019 3.2. Share premium 291,844 3.3. Treasury stock (9,471) 3.4. Revaluation surplus 7,496 3.5. Retained earnings 210,853 3.6. Other components of equity 62,818 Total equity 631,558 Total liabilities and equity 7,277,990 Off-balance items Contingencies and commitments (net) 804,472 PRUDENTIAL RATIOS BY THE BANK OF MONGOLIA
Ratios Requirement Actual Tier 1 capital ratio > 9% 13.75% Capital adequacy ratio >12% 14.16% Liquidity ratio >20% 40.23% Single foreign currency open position ratio <±15% 13.22% Total foreign currency open position ratio <±30% 26.16% AUDITED INCOME STATEMENT
2020/12/31 (In millions of MNT)
Income statement Items 1. Interest income 570,132 1.1. Balances with the Bank of Mongolia 13,921 1.2. Due from other banks and financial institutions 22,219 1.3. Investments in securities 49,912 1.4. Loans and advances to customers 466,069 1.5. Other 18,012 2. Interest expense 365,780 2.1. Customer accounts 13,525 2.2. Savings 279,528 2.3. Borrowed funds 60,154 2.4. Securities - 2.5. Other 12,572 3. Net interest income 204,353 4. Provision expenses 93,836 5. Net interest income after provision 110,516 6. Other income 99,996 6.1. Non-interest income 93,048 6.1.1. Gains from trading in foreign currencies 27,414 6.1.2. Gains from foreign currency exchange translation 15,962 6.1.3. Fees and commission income 49,672 6.1.4. Other non-interest income - 6.2. Other income 6,947 7. Other expense 188,023 7.1. Non-interest expense 174,730 7.1.1. Other provision expense 39,238 7.1.2. Losses from trading in foreign currencies - 7.1.3. Losses from foreign currency exchange translation - 7.1.4. Fees and commission expense 17,807 7.1.5. Other operating expense 117,685 7.2. Other expense 13,293 8. Profit before tax 22,489 9. Income tax expense 12,095 10. Profit after tax 10,394 11. Other comprehensive income 2,929 12. Total comprehensive income 13,323 LOANS AND OTHER EQUIVALENT ASSETS PROVIDED TO RELATED PARTIES OF THE BANK
2020/12/31 (In millions of MNT)
Related parties Category of assets Balance Share to capital 1. Loans and other equivalent asset provided to a related party (less than 5% of capital) 1.1. Shareholders of the Bank - - - 1.2. Key management personnel - - - 1.3. Other related parties Receivable 25,186 4.60% 2. Total Loans and other equivalent asset provided to related parties (less than 20% of capital) 2.1. Shareholders of the Bank Loan,Credit line, Receivable 25,348 4.63% 2.2. Key management personnel Loan, Credit line, Guarantee 3,440 0.63% 2.3. Other related parties Loan, Guarantee, Receivable 60,429 11.04% UNAUDITED FINANCIAL STATEMENTS
2020/09/30 (In millions of MNT)
Balance sheet Items 1. ASSETS 1.1. Cash and cash equivalents 1,933,085 1.2. Deposits with other banks and financial institutions 1,282,746 1.3 Financial investments 240,471 1.3.1. Investments in subsidiary - 1.4. Loans and advances to customers (net) 3,005,214 1.4.1. Performing loans 2,874,673 1.4.2. Non-performing loans 238,358 1.4.3. Deferred loan payments (9,212) 1.4.4. Accrued interest receivables 50,078 1.4.5. Provision for loan impairment (148,683) 1.5. Derivative financial assets 237,068 1.6. Other financial assets 184,295 1.7. Other non-financial assets 92,378 1.8. Premises and equipments 142,979 1.9. Investment properties 37,927 1.10. Assets for sale 47,414 1.11. Intangible assets 17,803 Total assets 7,221,381 2. LIABILITIES 2.1. Current accounts 1,369,442 2.2. Savings 3,728,686 2.3. Due to other banks and financial institutions 1,223,983 2.4. Other funds 161,898 2.5. Other liabilities 273,095 Total liabilities 6,757,103 3. EQUITY 3.1. Share capital 57,793 3.2. Share premium 134,190 3.3. Treasury stock (81) 3.4. Revaluation surplus 7,747 3.5. Retained earnings 240,678 3.6. Other components of equity 23,950 Total equity 464,278 Total liabilities and equity 7,221,381 Off-balance items Contingencies and commitments (net) 570,720 PRUDENTIAL RATIOS BY THE BANK OF MONGOLIA
Ratios Requirement Actual Tier 1 capital ratio > 9% 10.04% Capital adequacy ratio >12% 15.01% Liquidity ratio >20% 38.04% Single foreign currency open position ratio <±15% 12.09% Total foreign currency open position ratio <±30% 13.42% INCOME STATEMENT
2020/09/30 (In millions of MNT)
Income statement Items 1. Interest income 404,638 1.1. Balances with the Bank of Mongolia 10,830 1.2. Due from other banks and financial institutions 16,494 1.3. Investments in securities 30,687 1.4. Loans and advances to customers 301,738 1.5. Other 44,888 2. Interest expense 323,796 2.1. Customer accounts 13,526 2.2. Savings 205,722 2.3. Borrowed funds 44,772 2.4. Securities 1,536 2.5. Other 58,239 3. Net interest income 80,843 4. Provision expenses 75,329 5. Net interest income after provision 5,514 6. Other income 166,483 6.1. Non-interest income 132,329 6.1.1. Gains from trading in foreign currencies 20,310 6.1.2. Gains from foreign currency exchange translation 72,848 6.1.3. Fees and commission income 38,355 6.1.4. Other non-interest income 816 6.2. Other income 34,154 7. Other expense 149,634 7.1. Non-interest expense 147,394 7.1.1. Other provision expense 48,973 7.1.2. Losses from trading in foreign currencies - 7.1.3. Losses from foreign currency exchange translation - 7.1.4. Fees and commission expense 13,327 7.1.5. Other operating expense 85,094 7.2. Other expense 2,239 8. Profit before tax 22,364 9. Income tax expense 6,376 10. Profit after tax 15,988 LOANS AND OTHER EQUIVALENT ASSETS PROVIDED TO RELATED PARTIES OF THE BANK
2020/09/30 (In millions of MNT)
Related parties Category of assets Balance Share to capital 1. Loans and other equivalent asset provided to a related party (less than 5% of capital) 1.1. Shareholders of the Bank - - - 1.2. Key management personnel - - - 1.3. Other related parties Investment units 28,000 4.69% 2. Total Loans and other equivalent asset provided to related parties (less than 20% of capital) 2.1. Shareholders of the Bank Loan,Credit line, Receivable 25,398 4.26% 2.2. Key management personnel Loan, Credit line, Guarantee 3,183 0.53% 2.3. Other related parties Loan, Guarantee, Receivable, Share 80,385 13.47% UNAUDITED FINANCIAL STATEMENTS
2020/06/30 (In millions of MNT)
Balance sheet Items 1. ASSETS 1.1 Cash and cash equivalents 1,307,769 1.2 Deposits with other banks and financial institutions 1,307,738 1.3 Financial investments 232,541 1.3.1 Investments in subsidiary - 1.4 Loans and advances to customers (net) 3,025,278 1.4.1 Performing loans 2,887,432 1.4.2 Non-performing loans 201,712 1.4.3 Deferred loan payments (8,807) 1.4.4 Accrued interest receivables 61,266 1.4.5 Provision for loan impairment (116,325) 1.5 Derivative financial assets 244,879 1.6 Other financial assets 188,300 1.7 Other non-financial assets 128,388 1.8 Premises and equipments 145,554 1.9 Investment properties 45,513 1.10 Assets for sale 26,625 1.11 Intangible assets 16,489 Total assets 6,669,074 2. LIABILITIES 2.1 Current accounts 2.2 Savings 3,089,235 2.3 Due to other banks and financial institutions 1,089,952 2.4 Other funds 192,373 2.5 Other liabilities 301,025 Total liabilities 6,182,637 3. EQUITY 3.1 Share capital 57,793 3.2 Share premium 135,172 3.3 Treasury stock - 3.4 Revaluation surplus 7,747 3.5 Retained earnings 262,505 3.6 Other components of equity 23,220 Total equity 486,437 Total liabilities and equity 6,669,074 Off-balance items Contingencies and commitments (net) 474,602 PRUDENTIAL RATIOS BY THE BANK OF MONGOLIA
Ratios Requirement Actual Tier 1 capital ratio > 9% 10.79% Capital adequacy ratio >12% 15.85% Liquidity ratio >20% 30.77% Single foreign currency open position ratio <±15% 5.89% Total foreign currency open position ratio <±30% 10.85% INCOME STATEMENT
2020/06/30 (In millions of MNT)
Income statament items 1. Interest income 258,393 1.1 Balances with the Bank of Mongolia 7,883 1.2 Due from other banks and financial institutions 10,670 1.3 Investments in securities 16,086 1.4 Loans and advances to customers 197,090 1.5 Other 26,664 2. Interest expense 211,238 2.1 Customer accounts 13,533 2.2 Savings 135,903 2.3 Borrowed funds 25,590 2.4 Securities 1,536 2.5. Other 34,676 3. Net interest income 47,154 4. Provision expenses 57,199 5. Net interest income after provision (10,045) 6. Other income 159,871 6.1 Non-interest income 126,757 6.1.1 Gains from trading in foreign currencies 13,033 6.1.2 Gains from foreign currency exchange translation 87,040 6.1.3 Fees and commission income 25,466 6.1.4 Other non-interest income 1,217 6.2 Other income 33,114 7. Other expense 118,764 7.1 Non-interest expense 117,425 7.1.1 Other provision expense 47,375 7.1.2 Losses from trading in foreign currencies - 7.1.3 Losses from foreign currency exchange translation - 7.1.4 Fees and commission expense 12,352 7.1.5 Other operating expense 57,699 7.2 Other expense 1,338 8. Profit before tax 31,063 9. Income tax expense 6,247 10. Profit after tax 24,815 LOANS AND OTHER EQUIVALENT ASSETS PROVIDED TO RELATED PARTIES OF THE BANK
2020/06/30 (In millions of MNT)
Related parties Category of assets Balance Share to capital 1. Loans and other equivalent asset provided to a related party (less than 5% of capital) 1.1 Shareholders of the Bank - - - 1.2 Key management personnel - - - 1.3 Other related parties Loan, Receivable, Guarantee 28,762 4.65% 2 Total Loans and other equivalent asset provided to related parties (less than 20% of capital) 2.1 Shareholders of the Bank Loan,Credit line, Receivable 26,891 4.34% 2.2 Key management personnel In millions of MNT 3,205 0.52% 2.3 Other related parties Loan, Guarantee, Receivable 87,728 14.17% UNAUDITED FINANCIAL STATEMENTS
2020/03/31 (In millions of MNT)
Balance sheet Items 1. ASSETS 1.1 Cash and cash equivalents 1,492,063 1.2 Deposits with other banks and financial institutions 968,875 1.3 Financial investments 206,168 1.3.1 Investments in subsidiary - 1.4 Loans and advances to customers (net) 3,106,970 1.4.1 Performing loans 2,960,604 1.4.2 Non-performing loans 174,013 1.4.3 Deferred loan payments (8,512) 1.4.4 Accrued interest receivables 93,736 1.4.5 Provision for loan impairment (112,871) 1.5 Derivative financial assets 191,640 1.6 Other financial assets 199,458 1.7 Other non-financial assets 88,350 1.8 Premises and equipments 144,438 1.9 Investment properties 50,091 1.10 Assets for sale 68,345 1.11 Intangible assets 16,950 Total assets 6,533,348 2. LIABILITIES 2.1 Current accounts 1,678,789 2.2 Savings 2,996,236 2.3 Due to other banks and financial institutions 811,320 2.4 Other funds 272,285 2.5 Other liabilities 283,959 Total liabilities 6,042,589 3. EQUITY 3.1 Share capital 57,793 3.2 Share premium 135,172 3.3 Treasury stock - 3.4 Revaluation surplus 6,505 3.5 Retained earnings 273,755 3.6 Other components of equity 17,534 Total equity 490,759 Total liabilities and equity 6,533,348 Off-balance items Contingencies and commitments (net) 488,307 PRUDENTIAL RATIOS BY THE BANK OF MONGOLIA
Ratios Requirement Actual Tier 1 capital ratio > 9% 10.48% Capital adequacy ratio >12% 15.25% Liquidity ratio >20% 31.98% Single foreign currency open position ratio <±15% 6.73% Total foreign currency open position ratio <±30% 8.34% INCOME STATEMENT
2020/03/31 (In millions of MNT)
Income statament items 1. Interest income 151,048 1.1 Balances with the Bank of Mongolia 4,465 1.2 Due from other banks and financial institutions 5,304 1.3 Investments in securities 8,574 1.4 Loans and advances to customers 119,373 1.5 Other 13,332 2. Interest expense 109,113 2.1 Customer accounts 8,606 2.2 Savings 69,756 2.3 Borrowed funds 13,116 2.4 Securities 2.5. Other 17,635 3. Net interest income 41,935 4. Provision expenses 63,369 5. Net interest income after provision (21,434) 6. Other income 66,877 6.1 Non-interest income 63,711 6.1.1 Gains from trading in foreign currencies 8,545 6.1.2 Gains from foreign currency exchange translation 41,086 6.1.3 Fees and commission income 12,822 6.1.4 Other non-interest income 1,260 6.2 Other income 3,166 7. Other expense 42,639 7.1 Non-interest expense 42,012 7.1.1 Other provision expense 6,244 7.1.2 Losses from trading in foreign currencies - 7.1.3 Losses from foreign currency exchange translation - 7.1.4 Fees and commission expense 6,339 7.1.5 Other operating expense 29,429 7.2 Other expense 627 8. Profit before tax 2,805 9. Income tax expense 311 10. Profit after tax 2,494 LOANS AND OTHER EQUIVALENT ASSETS PROVIDED TO RELATED PARTIES OF THE BANK
2020/03/31 (In millions of MNT)
Related parties Category of assets Balance Share to capital 1. Loans and other equivalent asset provided to a related party (less than 5% of capital) 1.1 Shareholders of the Bank - - - 1.2 Key management personnel - - - 1.3 Other related parties Loan, Receivable, Guarantee 28,000 4.47% 2 Total Loans and other equivalent asset provided to related parties (less than 20% of capital) 2.1 Shareholders of the Bank Loan,Credit line, Receivable 28,050 4.47% 2.2 Key management personnel In millions of MNT 2,528 0.40% 2.3 Other related parties Loan, Guarantee, Receivable 77,206 12.31%
AUDITED FINANCIAL STATEMENTS
2019/12/31 (In millions of MNT)
Balance sheet Items 1. ASSETS 1.1 Cash and cash equivalents 1,465,380 1.2 Deposits with other banks and financial institutions 1,012,300 1.3 Financial investments 200,682 1.3.1 Investments in subsidiary - 1.4 Loans and advances to customers (net) 3,306,694 1.4.1 Performing loans 3,180,421 1.4.2 Non-performing loans 165,058 1.4.3 Deferred loan payments (9,299) 1.4.4 Accrued interest receivables 91,708 1.4.5 Provision for loan impairment (121,194) 1.5 Derivative financial assets 138,110 1.6 Other financial assets 156,375 1.7 Other non-financial assets 101,963 1.8 Premises and equipments 147,749 1.9 Investment properties 42,388 1.10 Assets for sale 57,125 1.11 Intangible assets 14,370 Total assets 6,643,136 2. LIABILITIES 2.1 Current accounts 1,809,998 2.2 Savings 3,003,032 2.3 Due to other banks and financial institutions 815,374 2.4 Other funds 268,031 2.5 Other liabilities 284,196 Total liabilities 6,180,631 3. EQUITY 3.1 Share capital 57,793 3.2 Share premium 135,172 3.3 Treasury stock - 3.4 Revaluation surplus 7,747 3.5 Retained earnings 197,396 3.6 Other components of equity 64,397 Total equity 462,505 Total liabilities and equity 6,643,136 Off-balance items Contingencies and commitments (net) 675,316 Prudential ratios by the Bank of Mongolia
Ratios Requirement Actual Tier 1 capital ratio > 9% 9.03% Capital adequacy ratio >12% 13.54% Liquidity ratio >25% 32.58% Single foreign currency open position ratio <±15% -0.91% Total foreign currency open position ratio <±30% -13.44% Audited Income statement
2019/12/31 (In millions of MNT)
Income statement Items 1. Interest income 577,892 1.1 Balances with the Bank of Mongolia 18,536 1.2 Due from other banks and financial institutions 21,176 1.3 Investments in securities 57,135 1.4 Loans and advances to customers 466,427 1.5 Other 14,617 2. Interest expense 366,007 2.1 Customer accounts 39,469 2.2 Savings 284,693 2.3 Borrowed funds 40,993 2.4 Securities - 2.5 Other 851 3. Net interest income 211,885 4. Provision expenses 135,445 5. Net interest income after provision 76,440 6. Other income 107,105 6.1 Non-interest income 96,687 6.1.1 Gains from trading in foreign currencies 12,299 6.1.2 Gains from foreign currency exchange translation 31,291 6.1.3 Fees and commission income 55,098 6.1.4 Other non-interest income - 6.2 Other income 8,417 7. Other expense 158,650 7.1 Non-interest expense 148,984 7.1.1 Other provision expense 11,582 7.1.2 Losses from trading in foreign currencies - 7.1.3 Losses from foreign currency exchange translation - 7.1.4 Fees and commission expense 17,094 7.1.5 Other operating expense 120,308 7.2 Other expense 9,666 8. Profit before tax 24,895 9. Income tax expense 8,590 10. Profit after tax 16,305 11. Other comprehensive income (5,451) 12. Total comprehensive income 10,853 LOANS AND OTHER EQUIVALENT ASSETS PROVIDED TO RELATED PARTIES OF THE BANK
2019/12/31 (In millions of MNT)
Related parties Category of assets Balance Share to capital 1. Loans and other equivalent asset provided to a related party (less than 5% of capital) 1.1 Shareholders of the Bank - - - 1.2 Key management personnel - - - 1.3 Other related parties Loan 27,905 4.8% 2 Total Loans and other equivalent asset provided to related parties (less than 20% of capital) 2.1 Shareholders of the Bank Loan 29,422 5.1% 2.2 Key management personnel Loan 2,209 0.4% 2.3 Other related parties Loan, Guarantee 67,234 11.7% UNAUDITED FINANCIAL STATEMENTS
2019/09/30 (In millions of MNT)
Balance sheet Items 1. ASSETS 1.1 Cash and cash equivalents 1,630,102 1.2 Deposits with other banks and financial institutions 1,044,918 1.3 Financial investments 207,672 1.3.1 Investments in subsidiary - 1.4 Loans and advances to customers (net) 3,151,752 1.4.1 Performing loans 2,987,225 1.4.2 Non-performing loans 228,035 1.4.3 Deferred loan payments (9,346) 1.4.4 Accrued interest receivables 88,907 1.4.5 Provision for loan impairment (143,069) 1.5 Derivative financial assets 201,529 1.6 Other financial assets 236,398 1.7 Other non-financial assets 46,014 1.8 Premises and equipments 129,116 1.9 Investment properties 50,150 1.10 Assets for sale 79,677 1.11 Intangible assets 15,917 Total assets 6,793,244 2. LIABILITIES 2.1 Current accounts 1,840,736 2.2 Savings 3,123,470 2.3 Due to other banks and financial institutions 854,664 2.4 Other funds 284,452 2.5 Other liabilities 138,895 Total liabilities 6,242,216 3. EQUITY 3.1 Share capital 108,101 3.2 Share premium 127,629 3.3 Treasury stock - 3.4 Revaluation surplus 6,855 3.5 Retained earnings 289,174 3.6 Other components of equity 19,269 Total equity 551,028 Total liabilities and equity 6,793,244 Off-balance items Contingencies and commitments (net) 593,270 Prudential ratios by the Bank of Mongolia
Ratios Requirement Actual Tier 1 capital ratio > 9% 10.0% Capital adequacy ratio >12% 13.9% Liquidity ratio >25% 33.5% Single foreign currency open position ratio <±15% -8.4% Total foreign currency open position ratio <±30% -13.5% INCOME STATEMENT
2019/09/30 (In millions of MNT)
Income statement Items 1. Interest income 437,815 1.1 Balances with the Bank of Mongolia 12,314 1.2 Due from other banks and financial institutions 15,095 1.3 Investments in securities 43,541 1.4 Loans and advances to customers 328,872 1.5 Other 37,994 2. Interest expense 300,590 2.1 Customer accounts 22,227 2.2 Savings 209,929 2.3 Borrowed funds 32,121 2.4 Securities - 2.5 Other 36,313 3. Net interest income 137,225 4. Provision expenses 86,299 5. Net interest income after provision 50,926 6. Other income 138,846 6.1 Non-interest income 136,846 6.1.1 Gains from trading in foreign currencies 10,389 6.1.2 Gains from foreign currency exchange translation 84,434 6.1.3 Fees and commission income 41,541 6.1.4 Other non-interest income - 6.2 Other income 2,483 7. Other expense 135,796 7.1 Non-interest expense 134,224 7.1.1 Other provision expense 29,604 7.1.2 Losses from trading in foreign currencies - 7.1.3 Losses from foreign currency exchange translation - 7.1.4 Fees and commission expense 17,138 7.1.5 Other operating expense 87,482 7.2 Other expense 1,572 8. Profit before tax 53,977 9. Income tax expense 4,199 10. Profit after tax 49,778 LOANS AND OTHER EQUIVALENT ASSETS PROVIDED TO RELATED PARTIES OF THE BANK
2019/09/30 (In millions of MNT)
Related parties Category of assets Balance Share to capital 1. Loans and other equivalent asset provided to a related party (less than 5% of capital) 1.1. Shareholders of the Bank - - - 1.2. Key management personnel - - - 1.3. Other related parties Loan 18,703 3.1% 2. Total Loans and other equivalent asset provided to related parties (less than 20% of capital) 2.1. Shareholders of the Bank Loan 17,185 2.8% 2.2. Key management personnel Loan 2,342 0.4% 2.3. Other related parties Loan, Guarantee 67,754 11.1% UNAUDITED FINANCIAL STATEMENTS
2019/06/30 (In millions of MNT)
Balance sheet Items 1. ASSETS 1.1 Cash and cash equivalents 1,415,809 1.2 Deposits with other banks and financial institutions 838,365 1.3 Financial investments 322,096 1.3.1 Investments in subsidiary - 1.4 Loans and advances to customers (net) 3,307,469 1.4.1 Performing loans 3,098,171 1.4.2 Non-performing loans 259,617 1.4.3 Deferred loan payments (9,866) 1.4.4 Accrued interest receivables 95,484 1.4.5 Provision for loan impairment (135,938) 1.5 Derivative financial assets 199,625 1.6 Other financial assets 107,601 1.7 Other non-financial assets 57,022 1.8 Premises and equipments 125,004 1.9 Investment properties 41,283 1.10 Assets for sale 81,201 1.11 Intangible assets 14,193 Total assets 6,509,667 2. LIABILITIES 2.1 Current accounts 1,624,094 2.2 Savings 2,984,327 2.3 Due to other banks and financial institutions 833,543 2.4 Other funds 347,954 2.5 Other liabilities 175,338 Total liabilities 5,965,257 3. EQUITY 3.1 Share capital 108,101 3.2 Share premium 127,629 3.3 Treasury stock - 3.4 Revaluation surplus 6,855 3.5 Retained earnings 277,586 3.6 Other components of equity 24,239 Total equity 544,410 Total liabilities and equity 6,509,667 Off-balance items Contingencies and commitments (net) 575,931 Prudential ratios by the Bank of Mongolia
Ratios Requirement Actual Tier 1 capital ratio > 9% 11.4% Capital adequacy ratio >14% 14.0% Liquidity ratio >25% 33.7% Single foreign currency open position ratio <±15% 6.1% Total foreign currency open position ratio <±40% 8.6% INCOME STATEMENT
2019/06/30
Income statement Items 1. Interest income 278,026 1.1 Balances with the Bank of Mongolia 8,102 1.2 Due from other banks and financial institutions 9,224 1.3 Investments in securities 32,869 1.4 Loans and advances to customers 204,955 1.5 Other 22,876 2. Interest expense 191,730 2.1 Customer accounts 13,335 2.2 Savings 137,112 2.3 Borrowed funds 19,834 2.4 Securities - 2.5 Other 21,449 3. Net interest income 86,296 4. Provision expenses 65,751 5. Net interest income after provision 20,545 6. Other income 166,842 6.1 Non-interest income 115,337 6.1.1 Gains from trading in foreign currencies 6,875 6.1.2 Gains from foreign currency exchange translation 81,966 6.1.3 Fees and commission income 26,496 6.1.4 Other non-interest income - 6.2 Other income 1,505 7. Other expense 93,012 7.1 Non-interest expense 91,931 7.1.1 Other provision expense 24,080 7.1.2 Losses from trading in foreign currencies - 7.1.3 Losses from foreign currency exchange translation - 7.1.4 Fees and commission expense 10,690 7.1.5 Other operating expense 57,161 7.2 Other expense 1,081 8. Profit before tax 44,375 9. Income tax expense 6,184 10. Profit after tax 38,191 LOANS AND OTHER EQUIVALENT ASSETS PROVIDED TO RELATED PARTIES OF THE BANK
2019/06/30 (In millions of MNT)
Related parties Category of assets Balance Share to capital 1. Loans and other equivalent asset provided to a related party (less than 5% of capital) 1.1 Shareholders of the Bank - - - 1.2 Key management personnel - - - 1.3 Other related parties Loan 18,853 3.1% 2 Total Loans and other equivalent asset provided to related parties (less than 20% of capital) 2.1 Shareholders of the Bank Loan 18,755 3.1% 2.2 Key management personnel Loan 2,479 0.4% 2.3 Other related parties Loan, Guarantee 73,410 12.2% UNAUDITED FINANCIAL STATEMENTS
2019/03/31 (In millions of MNT)
Balance sheet Items 1. ASSETS 1.1 Cash and cash equivalents 1,082,617 1.2 Deposits with other banks and financial institutions 871,647 1.3 Financial investments 385,927 1.3.1 Investments in subsidiary - 1.4 Loans and advances to customers (net) 3,107,894 1.4.1 Performing loans 2,858,420 1.4.2 Non-performing loans 341,447 1.4.3 Deferred loan payments (9,178) 1.4.4 Accrued interest receivables 116,953 1.4.5 Provision for loan impairment (199,748) 1.5 Derivative financial assets 115,352 1.6 Other financial assets 118,203 1.7 Other non-financial assets 56,428 1.8 Premises and equipments 120,202 1.9 Investment properties 37,567 1.10 Assets for sale 91,428 1.11 Intangible assets 14,401 Total assets 6,001,667 2. LIABILITIES 2.1 Current accounts 1,310,532 2.2 Savings 2,875,924 2.3 Due to other banks and financial institutions 870,749 2.4 Other funds 277,697 2.5 Other liabilities 146,657 Total liabilities 5,481,558 3. EQUITY 3.1 Share capital 108,101 3.2 Share premium 127,629 3.3 Treasury stock - 3.4 Revaluation surplus 6,962 3.5 Retained earnings 227,141 3.6 Other components of equity 50,276 Total equity 520,109 Total liabilities and equity 6,001,667 Off-balance items Contingencies and commitments (net) 528,012 Prudential ratios by the Bank of Mongolia
Ratios Requirement % Actual % Tier 1 capital ratio > 9% 10.8% Capital adequacy ratio >14% 14.0% Liquidity ratio >25% 32.4% Single foreign currency open position ratio <±15% -3.2% Total foreign currency open position ratio <±40% -7.4% INCOME STATEMENT
2019/03/31 (In millions of MNT)
Income statement Items 1. Interest income 152,343 1.1 Balances with the Bank of Mongolia 3,985 1.2 Due from other banks and financial institutions 4,257 1.3 Investments in securities 12,959 1.4 Loans and advances to customers 122,483 1.5 Other 8,658 2. Interest expense 89,670 2.1 Customer accounts 4,876 2.2 Savings 68,988 2.3 Borrowed funds 9,049 2.4 Securities - 2.5 Other 6,758 3. Net interest income 62,673 4. Provision expenses 38,325 5. Net interest income after provision 24,348 6. Other income 57,894 6.1 Non-interest income 57,718 6.1.1 Gains from trading in foreign currencies 45,088 6.1.2 Gains from foreign currency exchange translation - 6.1.3 Fees and commission income 12,630 6.1.4 Other non-interest income - 6.2 Other income 176 7. Other expense 76,679 7.1 Non-interest expense 76,361 7.1.1 Other provision expense 90 7.1.2 Losses from trading in foreign currencies - 7.1.3 Losses from foreign currency exchange translation 44,004 7.1.4 Fees and commission expense 4,872 7.1.5 Other operating expense 27,396 7.2 Other expense 318 8. Profit before tax 5,563 9. Income tax expense 23 10. Profit after tax 5,540 11. Other comprehensive income - 12. Total comprehensive income 5,540 LOANS AND OTHER EQUIVALENT ASSETS PROVIDED TO RELATED PARTIES OF THE BANK
2019/03/31 (In millions of MNT)
Related parties Category of assets Balance Share to capital 1. Loans and other equivalent asset provided to a related party (less than 5% of capital) 1.1 Shareholders of the Bank - - - 1.2 Key management personnel - - - 1.3 Other related parties Loan 20,950 3.7% 2 Total Loans and other equivalent asset provided to related parties (less than 20% of capital) 2.1 Shareholders of the Bank Loan 28,050 4.47% 2.2 Key management personnel Loan 3,438 0.6% 2.3 Other related parties Loan, Guarantee 77,146 13.6%
AUDITED FINANCIAL STATEMENTS
2018/12/31 (In millions of MNT)
Balance sheet Items 1. ASSETS 1.1. Cash and cash equivalents 1,181,731 1.2. Deposits with other banks and financial institutions 868,954 1.3 Financial investments 373,212 1.3.1. Investments in subsidiary - 1.4. Loans and advances to customers (net) 3,183,724 1.4.1. Performing loans 3,079,527 1.4.2. Non-performing loans 175,636 1.4.3. Deferred loan payments (10,940) 1.4.4. Accrued interest receivables 112,401 1.4.5. Provision for loan impairment (172,900) 1.5. Derivative financial assets 125,353 1.6. Other financial assets 55,534 1.7. Other non-financial assets 79,194 1.8. Premises and equipments 130,090 1.9. Investment properties 34,294 1.10. Assets for sale 34,777 1.11. Intangible assets 14,250 Total assets 6,081,113 2. LIABILITIES 2.1. Current accounts 1,441,007 2.2. Savings 2,859,629 2.3. Due to other banks and financial institutions 681,930 2.4. Other funds 440,643 2.5. Other liabilities 144,827 Total liabilities 5,568,037 3. EQUITY 3.1. Share capital 108,101 3.2. Share premium 127,629 3.3. Treasury stock - 3.4. Revaluation surplus 6,855 3.5. Retained earnings 202,843 3.6. Other components of equity 67,648 Total equity 513,076 Total liabilities and equity 6,081,113 Off-balance items Contingencies and commitments (net) 424,323 Prudential ratios by the Bank of Mongolia
Ratios Requirement % Actual % Tier 1 capital ratio > 9% 11.1% Capital adequacy ratio >14% 14.6% Liquidity ratio >25% 36.7% Single foreign currency open position ratio <±15% -2.1% Total foreign currency open position ratio <±40% -5.3% AUDITED INCOME STATEMENT
2018/12/31
Income statement Items 1. Interest income 493,961 1.1. Balances with the Bank of Mongolia 11,833 1.2. Due from other banks and financial institutions 10,902 1.3. Investments in securities 70,847 1.4. Loans and advances to customers 388,391 1.5. Other 11,989 2. Interest expense 323,255 2.1. Customer accounts 18,382 2.2. Savings 267,256 2.3. Borrowed funds 37,260 2.4. Securities 357 2.5. Other - 3. Net interest income 170,706 4. Provision expenses 66,151 5. Net interest income after provision 104,555 6. Other income 157,528 6.1. Non-interest income 139,117 6.1.1. Gains from trading in foreign currencies 19,173 6.1.2. Gains from foreign currency exchange translation 72,554 6.1.3. Fees and commission income 47,389 6.1.4. Other non-interest income - 6.2. Other income 18,412 7. Other expense 186,484 7.1. Non-interest expense 138,012 7.1.1. Other provision expense 16,949 7.1.2. Losses from trading in foreign currencies - 7.1.3. Losses from foreign currency exchange translation - 7.1.4. Fees and commission expense 12,323 7.1.5. Other operating expense 108,740 7.2. Other expense 48,472 8. Profit before tax 75,600 9. Income tax expense 22,054 10. Profit after tax 53,546 11. Other comprehensive income (4667) 12. Total comprehensive income 48,880 LOANS AND OTHER EQUIVALENT ASSETS PROVIDED TO RELATED PARTIES OF THE BANK
2018/12/31
Related parties Category of assets Balance Share to capital 1. Loans and other equivalent asset provided to a related party (less than 5% of capital) 1.1 Shareholders of the Bank - - - 1.2 Key management personne - - - 1.3 Other related parties Loan 22,930 4.0% 2 Total Loans and other equivalent asset provided to related parties (less than 20% of capital) 2.1 Shareholders of the Bank Loan 27,275 4.8% 2.2 Key management personnel Loan 2,629 0.5% 2.3 Other related parties Loan, Guarantee 70,770 12.4% UNAUDITED FINANCIAL STATEMENTS
2018/09/30 (In millions of MNT)
Balance sheet Items 1. ASSETS 1.1 Cash and cash equivalents 1,051,426 1.2 Deposits with other banks and financial institutions 566,816 1.3 Financial investments 310,216 1.3.1 Investments in subsidiary - 1.4 Loans and advances to customers (net) 2,794,836 1.4.1 Performing loans 2,624,199 1.4.2 Non-performing loans 230,889 1.4.3 Deferred loan payments (10,216) 1.4.4 Accrued interest receivables 132,912 1.4.5 Provision for loan impairment (182,947) 1.5 Derivative financial assets 100,797 1.6 Other financial assets 122,231 1.7 Other non-financial assets 89,740 1.8 Premises and equipments 106,443 1.9 Investment properties 41,220 1.10 Assets for sale 45,744 1.11 Intangible assets 17,170 Total assets 5,246,640 2. LIABILITIES 2.1 Current accounts 1,084,243 2.2 Savings 2,501,937 2.3 Due to other banks and financial institutions 734,125 2.4 Other funds 332,961 2.5 Other liabilities 151,710 Total liabilities 4,804,975 3. EQUITY 3.1 Share capital 104,392 3.2 Share premium 74,338 3.3 Treasury stock - 3.4 Revaluation surplus 3,962 3.5 Retained earnings 181,443 3.6 Other components of equity 77,530 Total equity 441,665 Total liabilities and equity 5,246,640 Off-balance items Contingencies and commitments (net) 430,727 Prudential ratios by the Bank of Mongolia
Ratios Requirement Actual Tier 1 capital ratio > 9% 9.38% Capital adequacy ratio >14% 14.05% Liquidity ratio >25% 30.90% Single foreign currency open position ratio <±15% -1.48% Total foreign currency open position ratio <±40% -7.42% INCOME STATEMENT
2018/09/30 (In millions of MNT)
Income statement Items 1. Interest income 366,275 1.1 Balances with the Bank of Mongolia 8,611 1.2 Due from other banks and financial institutions 6,589 1.3 Investments in securities 57,562 1.4 Loans and advances to customers 284,133 1.5 Other 9,380 2. Interest expense 239,562 2.1 Customer accounts 13,536 2.2 Savings 199,595 2.3 Borrowed funds 24,393 2.4 Securities 200 2.5 Other 1,838 3. Net interest income 126,713 4. Provision expenses 100,568 5. Net interest income after provision 26,146 6. Other income 112,888 6.1 Non-interest income 96,148 6.1.1 Gains from trading in foreign currencies 8,599 6.1.2 Gains from foreign currency exchange translation 53,736 6.1.3 Fees and commission income 33,814 6.1.4 Other non-interest income - 6.2 Other income 16,740 7. Other expense 99,182 7.1 Non-interest expense 96,060 7.1.1 Other provision expense 14,865 7.1.2 Losses from trading in foreign currencies - 7.1.3 Losses from foreign currency exchange translation - 7.1.4 Fees and commission expense 11,425 7.1.5 Other operating expense 69,770 7.2 Other expense 3,122 8. Profit before tax 39,852 9. Income tax expense 7,755 10. Profit after tax 32,096 11. Other comprehensive income - 12. Total comprehensive income 32,096 LOANS AND OTHER EQUIVALENT ASSETS PROVIDED TO RELATED PARTIES OF THE BANK
2018/09/30 (In millions of MNT)
Related parties Category of assets Balance Share to capital 1. Loans and other equivalent asset provided to a related party (less than 5% of capital) 1.1 Shareholders of the Bank - - - 1.2 Key management personnel - - - 1.3 Other related parties Loan 21,647 4.3% 2 Total Loans and other equivalent asset provided to related parties (less than 20% of capital)
2.1 Shareholders of the Bank Loan 3,998 0.8% 2.2 Key management personnel Loan 2,005 0.4% 2.3 Other related parties Loan, Guarantee 82,136 16.5% UNAUDITED FINANCIAL STATEMENTS
2018/06/30 (In millions of MNT)
Balance sheet Items 1. ASSETS 1.1 Cash and cash equivalents 1,302,358 1.2 Deposits with other banks and financial institutions 334,084 1.3 Financial investments 457,629 1.3.1 Investments in subsidiary 1,200 1.4 Loans and advances to customers (net) 2,800,240 1.4.1 Performing loans 2,572,466 1.4.2 Non-performing loans 224,324 1.4.3 Deferred loan payments (10,289) 1.4.4 Accrued interest receivables 188,909 1.4.5 Provision for loan impairment (175,170) 1.5 Derivative financial assets 71,407 1.6 Other financial assets 128,204 1.7 Other non-financial assets 48,251 1.8 Premises and equipments 147,855 1.9 Investment properties 37,306 1.10 Assets for sale 31,426 1.11 Intangible assets 16,308 Total assets 5,393,068 2. LIABILITIES 2.1 Current accounts 1,196,971 2.2 Savings 2,465,845 2.3 Due to other banks and financial institutions 767,314 2.4 Other funds 334,792 2.5 Other liabilities 144,343 Total liabilities 4,909,265 3. EQUITY 3.1 Share capital 104,392 3.2 Share premium 74,338 3.3 Treasury stock - 3.4 Revaluation surplus 3,962 3.5 Retained earnings 224,618 3.6 Other components of equity 76,493 Total equity 483,803 Total liabilities and equity 5,393,068 Off-balance items Contingencies and commitments (net) 490,308 Prudential ratios by the Bank of Mongolia
Ratios Requirement % Actual % Tier 1 capital ratio > 9% 9.9% Capital adequacy ratio >14% 14.1% Liquidity ratio >25% 33.0% Single foreign currency open position ratio <±15% 9.4% Total foreign currency open position ratio <±40% 11.2% INCOME STATEMENT
2018/06/30 (In millions of MNT)
Income statement Items 1. Interest income 294,323 1.1 Balances with the Bank of Mongolia 6,054 1.2 Due from other banks and financial institutions 3,856 1.3 Investments in securities 44,386 1.4 Loans and advances to customers 234,217 1.5 Other 5,810 2. Interest expense 159,151 2.1 Customer accounts 8,265 2.2 Savings 133,998 2.3 Borrowed funds 15,771 2.4 Securities - 2.5 Other 1,118 3. Net interest income 135,172 4. Provision expenses 78,991 5. Net interest income after provision 56,181 6. Other income 43,388 6.1 Non-interest income 26,997 6.1.1 Gains from trading in foreign currencies 4,885 6.1.2 Gains from foreign currency exchange translation - 6.1.3 Fees and commission income 22,112 6.1.4 Other non-interest income - 6.2 Other income 16,391 7. Other expense 74,339 7.1 Non-interest expense 71,562 7.1.1 Other provision expense 7,124 7.1.2 Losses from trading in foreign currencies - 7.1.3 Losses from foreign currency exchange translation 12,822 7.1.4 Fees and commission expense 7,244 7.1.5 Other operating expense 44,372 7.2 Other expense 2,777 8. Profit before tax 25,230 9. Income tax expense 4,258 10. Profit after tax 20,972 LOANS AND OTHER EQUIVALENT ASSETS PROVIDED TO RELATED PARTIES OF THE BANK
2018/06/30 (In millions of MNT)
Related parties Category of assets Balance Share to capital 1. Loans and other equivalent asset provided to a related party (less than 5% of capital) 1.1 Shareholders of the Bank - - - 1.2 Key management personnel - - - 1.3 Other related parties Loan 20,889 3.6% 2 Total Loans and other equivalent asset provided to related parties (less than 20% of capital) 2.1 Shareholders of the Bank Loan 756 0.1% 2.2 Key management personnel Loan 1,190 0.2% 2.3 Other related parties Loan, Guarantee 81,066 13.9% UNAUDITED FINANCIAL STATEMENTS
2018/03/31 (In millions of MNT)
Balance sheet Items 1. ASSETS 1.1 Cash and cash equivalents 1,753,470 1.2 Deposits with other banks and financial institutions 74,827 1.3 Financial investments 520,904 1.3.1 Investments in subsidiary 1,200 1.4 Loans and advances to customers (net) 2,272,111 1.4.1 Performing loans 2,078,102 1.4.2 Non-performing loans 188,253 1.4.3 Deferred loan payments (5,617) 1.4.4 Accrued interest receivables 100,691 1.4.5 Provision for loan impairment (89,318) 1.5 Derivative financial assets 1.6 Other financial assets 96,399 1.7 Other non-financial assets 25,587 1.8 Premises and equipments 164,813 1.9 Investment properties 59,927 1.10 Assets for sale 45,997 1.11 Intangible assets 16,435 Total assets 5,097,163 2. LIABILITIES 2.1 Current accounts 910,496 2.2 Savings 2,446,902 2.3 Due to other banks and financial institutions 893,146 2.4 Other funds 275,404 2.5 Other liabilities 160,952 Total liabilities 4,686,902 3. EQUITY 3.1 Share capital 52,146 3.2 Share premium 46,584 3.3 Treasury stock - 3.4 Revaluation surplus 9,204 3.5 Retained earnings 256,290 3.6 Other components of equity 46,037 Total equity 410,261 Total liabilities and equity 5,097,163 Off-balance items Contingencies and commitments (net) 519,866 Prudential ratios by the Bank of Mongolia
Ratios Requirement Actual Tier 1 capital ratio > 9% 9.6% Capital adequacy ratio >14% 14.4% Liquidity ratio >25% 40.3% Single foreign currency open position ratio <±15% -5.3% Total foreign currency open position ratio <±40% -9.5% INCOME STATEMENT
2018/03/31 (In millions of MNT)
Income statement Items 1. Interest income 116,238 1.1 Balances with the Bank of Mongolia 2,816 1.2 Due from other banks and financial institutions 1,344 1.3 Investments in securities 25,160 1.4 Loans and advances to customers 83,898 1.5 Other 3,019 2. Interest expense 79,732 2.1 Customer accounts 4,118 2.2 Savings 67,047 2.3 Borrowed funds 7,976 2.4 Securities - 2.5 Other 590 3. Net interest income 36,507 4. Provision expenses 23,083 5. Net interest income after provision 13,424 6. Other income 28,093 6.1 Non-interest income 12,825 6.1.1 Gains from trading in foreign currencies 2,742 6.1.2 Gains from foreign currency exchange translation - 6.1.3 Fees and commission income 10,083 6.1.4 Other non-interest income - 6.2 Other income 15,268 7. Other expense 31,988 7.1 Non-interest expense 31,791 7.1.1 Other provision expense 1,262 7.1.2 Losses from trading in foreign currencies - 7.1.3 Losses from foreign currency exchange translation 4,920 7.1.4 Fees and commission expense 3,498 7.1.5 Other operating expense 22,111 7.2 Other expense 198 8. Profit before tax 9,529 9. Income tax expense 181 10. Profit after tax 9,349 LOANS AND OTHER EQUIVALENT ASSETS PROVIDED TO RELATED PARTIES OF THE BANK
2018/03/31 (In millions of MNT)
Related parties Category of assets Balance Share to capital 1. Loans and other equivalent asset provided to a related party (less than 5% of capital) 1.1 Shareholders of the Bank - - - 1.2 Key management personnel - - - 1.3 Other related parties Loan 20,295 4.1% 2 Total Loans and other equivalent asset provided to related parties (less than 20% of capital) 2.1 Shareholders of the Bank Loan 4,953 1.0% 2.2 Key management personnel Loan 132 0.0% 2.3 Other related parties Loan, Guarantee 83,780 17.0%
AUDITED FINANCIAL STATEMENTS
2017/12/31 (In millions of MNT)
Balance sheet Items 1. ASSETS 1.1. Cash and cash equivalents 1,140,313 1.2. Deposits with other banks and financial institutions 701,376 1.3 Financial investments 613,716 1.3.1. Investments in subsidiary 1,200 1.4. Loans and advances to customers (net) 2,318,058 1.4.1. Performing loans 2,116,535 1.4.2. Non-performing loans 192,495 1.4.3. Deferred loan payments (6,138) 1.4.4. Accrued interest receivables 110,699 1.4.5. Provision for loan impairment (95,533) 1.5. Derivative financial assets 75,466 1.6. Other financial assets 64,536 1.7. Other non-financial assets 26,886 1.8. Premises and equipments 140,555 1.9. Investment properties 57,506 1.10. Assets for sale 52,556 1.11. Intangible assets 13,617 Total assets 5,204,584 2. LIABILITIES 2.1. Current accounts 998,977 2.2. Savings 2,412,575 2.3. Due to other banks and financial institutions 968,162 2.4. Other funds 267,728 2.5. Other liabilities 165,453 Total liabilities 4,812,895 3. EQUITY 3.1. Share capital 52,146 3.2. Share premium 46,584 3.3. Treasury stock - 3.4. Revaluation surplus 3,962 3.5. Retained earnings 218,534 3.6. Other components of equity 70,463 Total equity 391,689 Total liabilities and equity 5,204,584 Off-balance items Contingencies and commitments (net) 545,529 Prudential ratios by the Bank of Mongolia
Ratios Requirement Actual Tier 1 capital ratio > 9% 9.3% Capital adequacy ratio >14% 14.4% Liquidity ratio >25% 44.3% Single foreign currency open position ratio <±15% -11.0% Total foreign currency open position ratio <±40% -15.2% INCOME STATEMENT
2017/12/31 (In millions of MNT)
Income statement Items 1. Interest income 409,220 1.1. Balances with the Bank of Mongolia 12,418 1.2. Due from other banks and financial institutions 3,153 1.3. Investments in securities 99,784 1.4. Loans and advances to customers 287,085 1.5. Other 6,780 2. Interest expense 287,230 2.1. Customer accounts 13,685 2.2. Savings 228,481 2.3. Borrowed funds 45,063 2.4. Securities - 2.5. Other - 3. Net interest income 121,990 4. Provision expenses 33,412 5. Net interest income after provision 88,579 6. Other income 97,758 6.1. Non-interest income 92,268 6.1.1. Gains from trading in foreign currencies 56,617 6.1.2. Gains from foreign currency exchange translation - 6.1.3. Fees and commission income 35,650 6.1.4. Other non-interest income - 6.2. Other income 5,490 7. Other expense 198,419 7.1. Non-interest expense 172,657 7.1.1. Other provision expense (239) 7.1.2. Losses from trading in foreign currencies - 7.1.3. Losses from foreign currency exchange translation 78,652 7.1.4. Fees and commission expense 9,809 7.1.5. Other operating expense 84,434 7.2. Other expense 25,763 8. Profit before tax (12,083) 9. Income tax expense (6,930) 10. Profit after tax (5,153) 11. Other comprehensive income 30,268 12. Total comprehensive income 25,116 LOANS AND OTHER EQUIVALENT ASSETS PROVIDED TO RELATED PARTIES OF THE BANK
2017/12/31 (In millions of MNT)
Related parties Category of assets Balance Share to capital 1. Loans and other equivalent asset provided to a related party (less than 5% of capital) 1.1 Shareholders of the Bank - - - 1.2 Key management personnel - - - 1.3 Other related parties Loan 20,586 4.2% 2 Total Loans and other equivalent asset provided to related parties (less than 20% of capital) 2.1 Shareholders of the Bank Loan 5,610 1.1% 2.2 Key management personnel Loan 133 0.0% 2.3 Other related parties Loan, Guarantee 81,943 16.6% UNAUDITED FINANCIAL STATEMENTS
2017/09/30 (In millions of MNT)
Balance sheet Items (In millions of MNT) 1. ASSETS 1.1 Cash and cash equivalents 1,726,334 1.2 Deposits with other banks and financial institutions 61,642 1.3 Financial investments 606,134 1.3.1 Investments in subsidiary 1,200 1.4 Loans and advances to customers (net) 2,099,185 1.4.1 Performing loans 1,865,004 1.4.2 Non-performing loans 197,906 1.4.3 Deferred loan payments (6,238) 1.4.4 Accrued interest receivables 112,968 1.4.5 Provision for loan impairment (70,456) 1.5 Derivative financial assets 87,022 1.6 Other financial assets 100,891 1.7 Other non-financial assets 65,316 1.8 Premises and equipments 176,160 1.9 Investment properties 63,288 1.10 Assets for sale 41,416 1.11 Intangible assets 16,247 Total assets 5,043,636 2. LIABILITIES 2.1 Current accounts 971,525 2.2 Savings 2,219,975 2.3 Due to other banks and financial institutions 1,050,458 2.4 Other funds 217,808 2.5 Other liabilities 187,692 Total liabilities 4,647,459 3. EQUITY 3.1 Share capital 52,146 3.2 Share premium 46,584 3.3 Treasury stock - 3.4 Revaluation surplus 9,645 3.5 Retained earnings 242,535 3.6 Other components of equity 45,267 Total equity 369,177 Total liabilities and equity 5,043,636 Off-balance items Contingencies and commitments (net) 468,182 Prudential ratios by the Bank of Mongolia
Ratios Requirement Actual Tier 1 capital ratio > 9% 9.5% Capital adequacy ratio >14% 14.6% Liquidity ratio >25% 44.8% Single foreign currency open position ratio <±15% -3.8% Total foreign currency open position ratio <±40% -10.9% INCOME STATEMENT
2017/09/30 (In millions of MNT)
Income statement Items 1. Interest income 296,631 1.1 Balances with the Bank of Mongolia 9,848 1.2 Due from other banks and financial institutions 2,069 1.3 Investments in securities 75,238 1.4 Loans and advances to customers 204,323 1.5 Other 5,154 2. Interest expense 208,602 2.1 Customer accounts 9,906 2.2 Savings 164,790 2.3 Borrowed funds 33,906 2.4 Securities - 2.5 Other - 3. Net interest income 88,029 4. Provision expenses 25,120 5. Net interest income after provision 62,909 6. Other income 81,616 6.1 Non-interest income 76,799 6.1.1 Gains from trading in foreign currencies 49,563 6.1.2 Gains from foreign currency exchange translation - 6.1.3 Fees and commission income 25,971 6.1.4 Other non-interest income 1,264 6.2 Other income 4,818 7. Other expense 142,429 7.1 Non-interest expense 142,083 7.1.1 Other provision expense 2,790 7.1.2 Losses from trading in foreign currencies - 7.1.3 Losses from foreign currency exchange translation 74,665 7.1.4 Fees and commission expense 8,124 7.1.5 Other operating expense 56,504 7.2 Other expense 347 8. Profit before tax 2,096 9. Income tax expense - 10. Profit after tax 2,096 11. Other comprehensive income 7,113 12. Total comprehensive income 9,209 LOANS AND OTHER EQUIVALENT ASSETS PROVIDED TO RELATED PARTIES OF THE BANK
2017/09/30 (In millions of MNT)
Related parties Category of assets Balance Share to capital 1. Loans and other equivalent asset provided to a related party (less than 5% of capital) 1.1 Shareholders of the Bank - - - 1.2 Key management personnel - - - 1.3 Other related parties Loan 20,903 4.3% 2 Total Loans and other equivalent asset provided to related parties (less than 20% of capital) 2.1 Shareholders of the Bank Loan 5,621 1.2% 2.2 Key management personnel Loan 778 0.2% 2.3 Other related parties Loan, Guarantee 87,238 18.1% UNAUDITED FINANCIAL STATEMENTS
2017/06/30 (In millions of MNT)
Balance sheet Items (In millions of MNT) 1. ASSETS 1.1 Cash and cash equivalents 1,412,774 1.2 Deposits with other banks and financial institutions 58,857 1.3 Financial investments 1.3.1 Investments in subsidiary 1,200 1.4 Loans and advances to customers (net) 2,082,995 1.4.1 Performing loans 1,911,252 1.4.2 Non-performing loans 178,670 1.4.3 Deferred loan payments (6,171) 1.4.4 Accrued interest receivables 82,282 1.4.5 Provision for loan impairment (83,037) 1.5 Derivative financial assets 79,954 1.6 Other financial assets 93,405 1.7 Other non-financial assets 64,348 1.8 Premises and equipments 195,238 1.9 Investment properties 63,312 1.10 Assets for sale 9,861 1.11 Intangible assets 15,561 Total assets 4,656,906 2. LIABILITIES 2.1 Current accounts 805,360 2.2 Savings 2,072,418 2.3 Due to other banks and financial institutions 758,671 2.4 Other funds 469,144 2.5 Other liabilities 163,493 Total liabilities 4,269,087 3. EQUITY 3.1 Share capital 52,146 3.2 Share premium 46,584 3.3 Treasury stock - 3.4 Revaluation surplus 30,004 3.5 Retained earnings 241,079 3.6 Other components of equity 18,006 Total equity 387,819 Total liabilities and equity 4,656,906 Off-balance items Contingencies and commitments (net) 438,470 Prudential ratios by the Bank of Mongolia
Ratios Requirement Actual Tier 1 capital ratio > 9% 9.7% Capital adequacy ratio >14% 14.5% Liquidity ratio >25% 41.5% Single foreign currency open position ratio <±15% -13.7% Total foreign currency open position ratio <±40% -22.3% INCOME STATEMENT
2017/06/30 (In millions of MNT)
Income statement Items 1. Interest income 195,063 1.1 Balances with the Bank of Mongolia 6,119 1.2 Due from other banks and financial institutions 969 1.3 Investments in securities 49,510 1.4 Loans and advances to customers 134,979 1.5 Other 3,486 2. Interest expense 135,101 2.1 Customer accounts 5,913 2.2 Savings 106,389 2.3 Borrowed funds 22,798 2.4 Securities - 2.5 Other - 3. Net interest income 59,962 4. Provision expenses 14,470 5. Net interest income after provision 45,222 6. Other income 63,789 6.1 Non-interest income 61,323 6.1.1 Gains from trading in foreign currencies 43,667 6.1.2 Gains from foreign currency exchange translation - 6.1.3 Fees and commission income 16,379 6.1.4 Other non-interest income 1,277 6.2 Other income 2,465 7. Other expense 108,370 7.1 Non-interest expense 108,101 7.1.1 Other provision expense 1,067 7.1.2 Losses from trading in foreign currencies - 7.1.3 Losses from foreign currency exchange translation 64,873 7.1.4 Fees and commission expense 5,160 7.1.5 Other operating expense 37,001 7.2 Other expense 269 8. Profit before tax 640 9. Income tax expense - 10. Profit after tax 640 11. Other comprehensive income 246 12. Total comprehensive income 886 LOANS AND OTHER EQUIVALENT ASSETS PROVIDED TO RELATED PARTIES OF THE BANK
2017/06/30 (In millions of MNT)
Related parties Category of assets Balance Share to capital 1. Loans and other equivalent asset provided to a related party (less than 5% of capital) 1.1 Shareholders of the Bank - - - 1.2 Key management personnel - - - 1.3 Other related parties Зээл 19,925 4.2% 2 Total Loans and other equivalent asset provided to related parties (less than 20% of capital) 2.1 Shareholders of the Bank Loan, Guarantee 4,721 1.0% 2.2 Key management personnel Loan, Guarantee 847 0.2% 2.3 Other related parties Loan, Guarantee 85,465 18.2% UNAUDITED FINANCIAL STATEMENTS
2017/03/31 (In millions of MNT)
Balance sheet Items 1. ASSETS 1.1 Cash and cash equivalents 1,438,221 1.2 Deposits with other banks and financial institutions - 1.3 Financial investments 533,697 1.3.1 Investments in subsidiary 1,200 1.4 Loans and advances to customers (net) 2,016,496 1.4.1 Performing loans 1,868,659 1.4.2 Non-performing loans 179,788 1.4.3 Deferred loan payments (4,978) 1.4.4 Accrued interest receivables 59,302 1.4.5 Provision for loan impairment (86,274) 1.5 Derivative financial assets 159,277 1.6 Other financial assets 96,371 1.7 Other non-financial assets 53,956 1.8 Premises and equipments 191,868 1.9 Investment properties 1.10 Assets for sale 16,968 1.11 Intangible assets 16,856 Total assets 4,574,700 2. LIABILITIES 2.1 Current accounts 699,756 2.2 Savings 1,995,110 2.3 Due to other banks and financial institutions 1,147,072 2.4 Other funds 190,652 2.5 Other liabilities 152,537 Total liabilities 4,185,127 3. EQUITY 3.1 Share capital 52,146 3.2 Share premium 46,584 3.3 Treasury stock - 3.4 Revaluation surplus 30,004 3.5 Retained earnings 243,019 3.6 Other components of equity 17,820 Total equity 389,573 Total liabilities and equity 4,574,700 Off-balance items Contingencies and commitments (net) 354,081 Prudential ratios by the Bank of Mongolia
Ratios Requirement Actual Tier 1 capital ratio > 9% 10.14% Capital adequacy ratio >14% 14.87% Liquidity ratio >25% 42.9% Single foreign currency open position ratio <±15% -12.84% Total foreign currency open position ratio <±40% -19.66% INCOME STATEMENT
2017/03/31 (In millions of MNT)
Income statement Items 1. Interest income 93,184 1.1 Balances with the Bank of Mongolia 2,796 1.2 Due from other banks and financial institutions 317 1.3 Investments in securities 23,044 1.4 Loans and advances to customers 65,492 1.5 Other 1,535 2. Interest expense 64,525 2.1 Customer accounts 2,781 2.2 Savings 50,516 2.3 Borrowed funds 11,228 2.4 Securities - 2.5 Other - 3. Net interest income 28,659 4. Provision expenses 7,179 5. Net interest income after provision 21,480 6. Other income 10,146 6.1 Non-interest income 10,068 6.1.1 Gains from trading in foreign currencies 2,804 6.1.2 Gains from foreign currency exchange translation - 6.1.3 Fees and commission income 7,264 6.1.4 Other non-interest income - 6.2 Other income 78 7. Other expense 29,046 7.1 Non-interest expense 28,905 7.1.1 Other provision expense 1 7.1.2 Losses from trading in foreign currencies - 7.1.3 Losses from foreign currency exchange translation 8,791 7.1.4 Fees and commission expense 2,381 7.1.5 Other operating expense 17,732 7.2 Other expense 141 8. Profit before tax 2,580 9. Income tax expense - 10. Profit after tax 2,580 11. Other comprehensive income - 12. Total comprehensive income 2,580 LOANS AND OTHER EQUIVALENT ASSETS PROVIDED TO RELATED PARTIES OF THE BANK
2017/03/31 (In millions of MNT)
Related parties Category of assets Balance Share to capital 1. Loans and other equivalent asset provided to a related party (less than 5% of capital) 1.1 Shareholders of the Bank - - - 1.2 Key management personnel - - - 1.3 Other related parties Зээл 20,544 4.44% 2 Total Loans and other equivalent asset provided to related parties (less than 20% of capital) 2.1 Shareholders of the Bank Loan 7,536 1.6% 2.2 Key management personnel Loan 946 0.2% 2.3 Other related parties Loan, Guarantee 66,319 14.3%
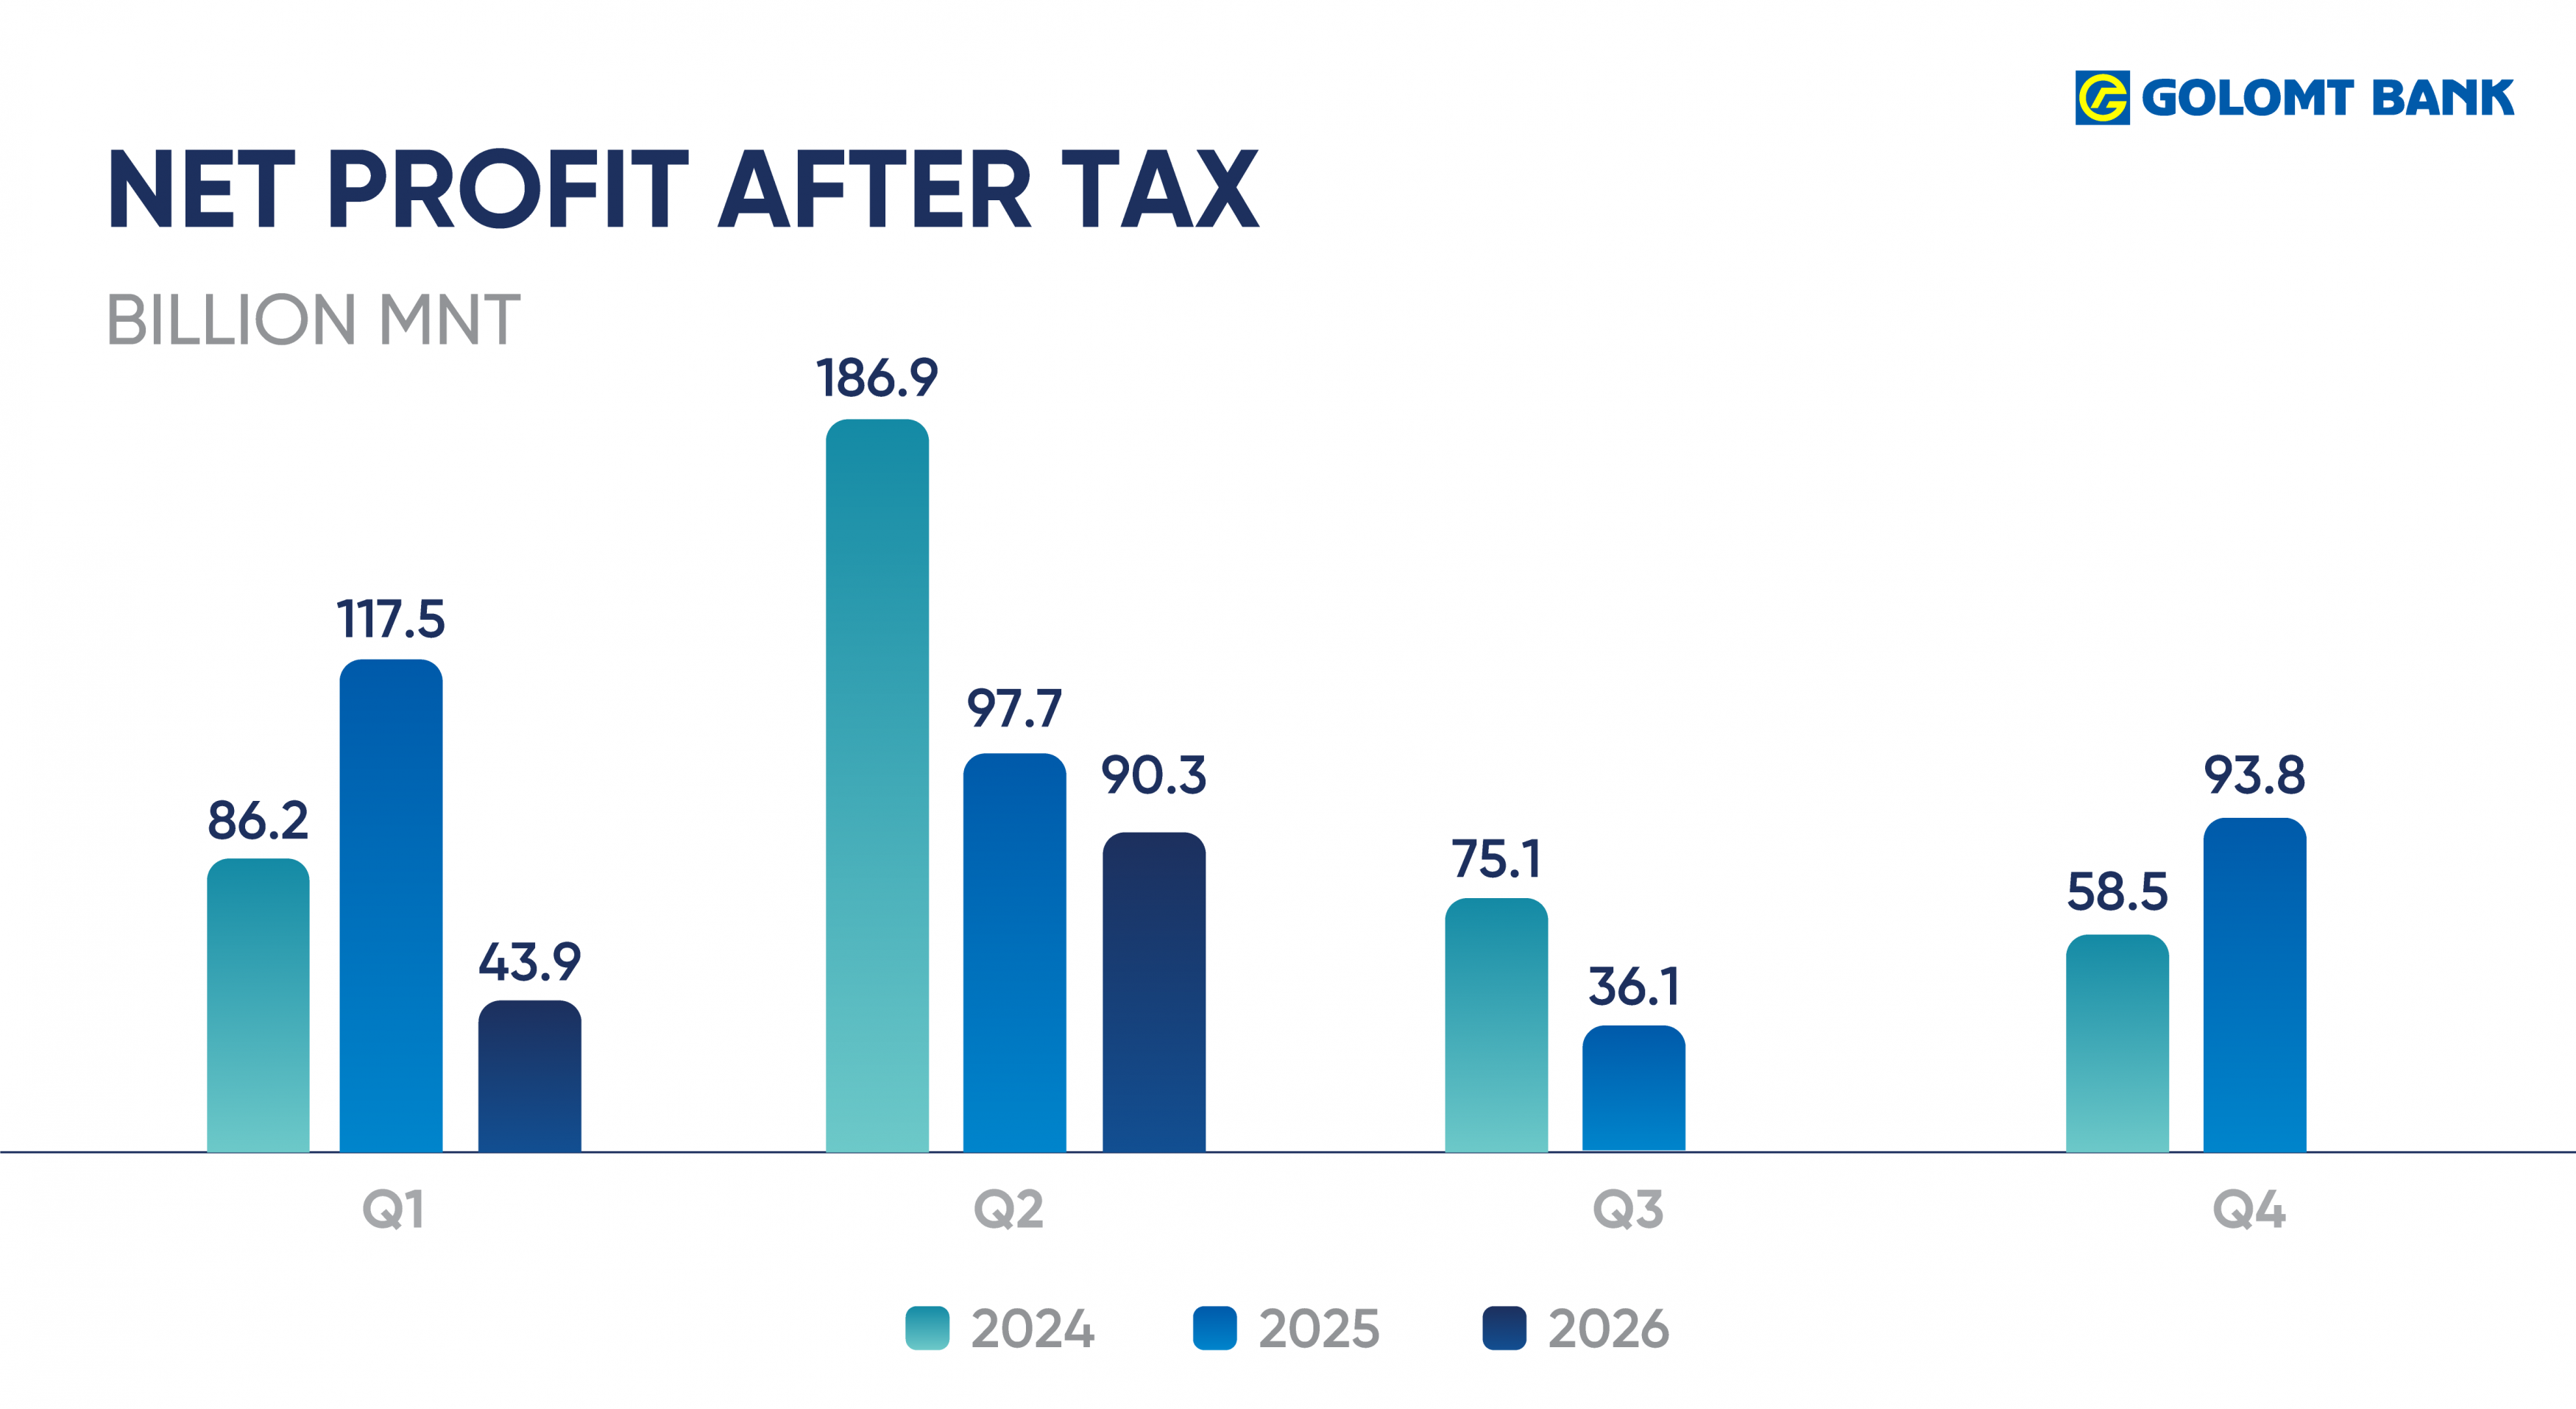
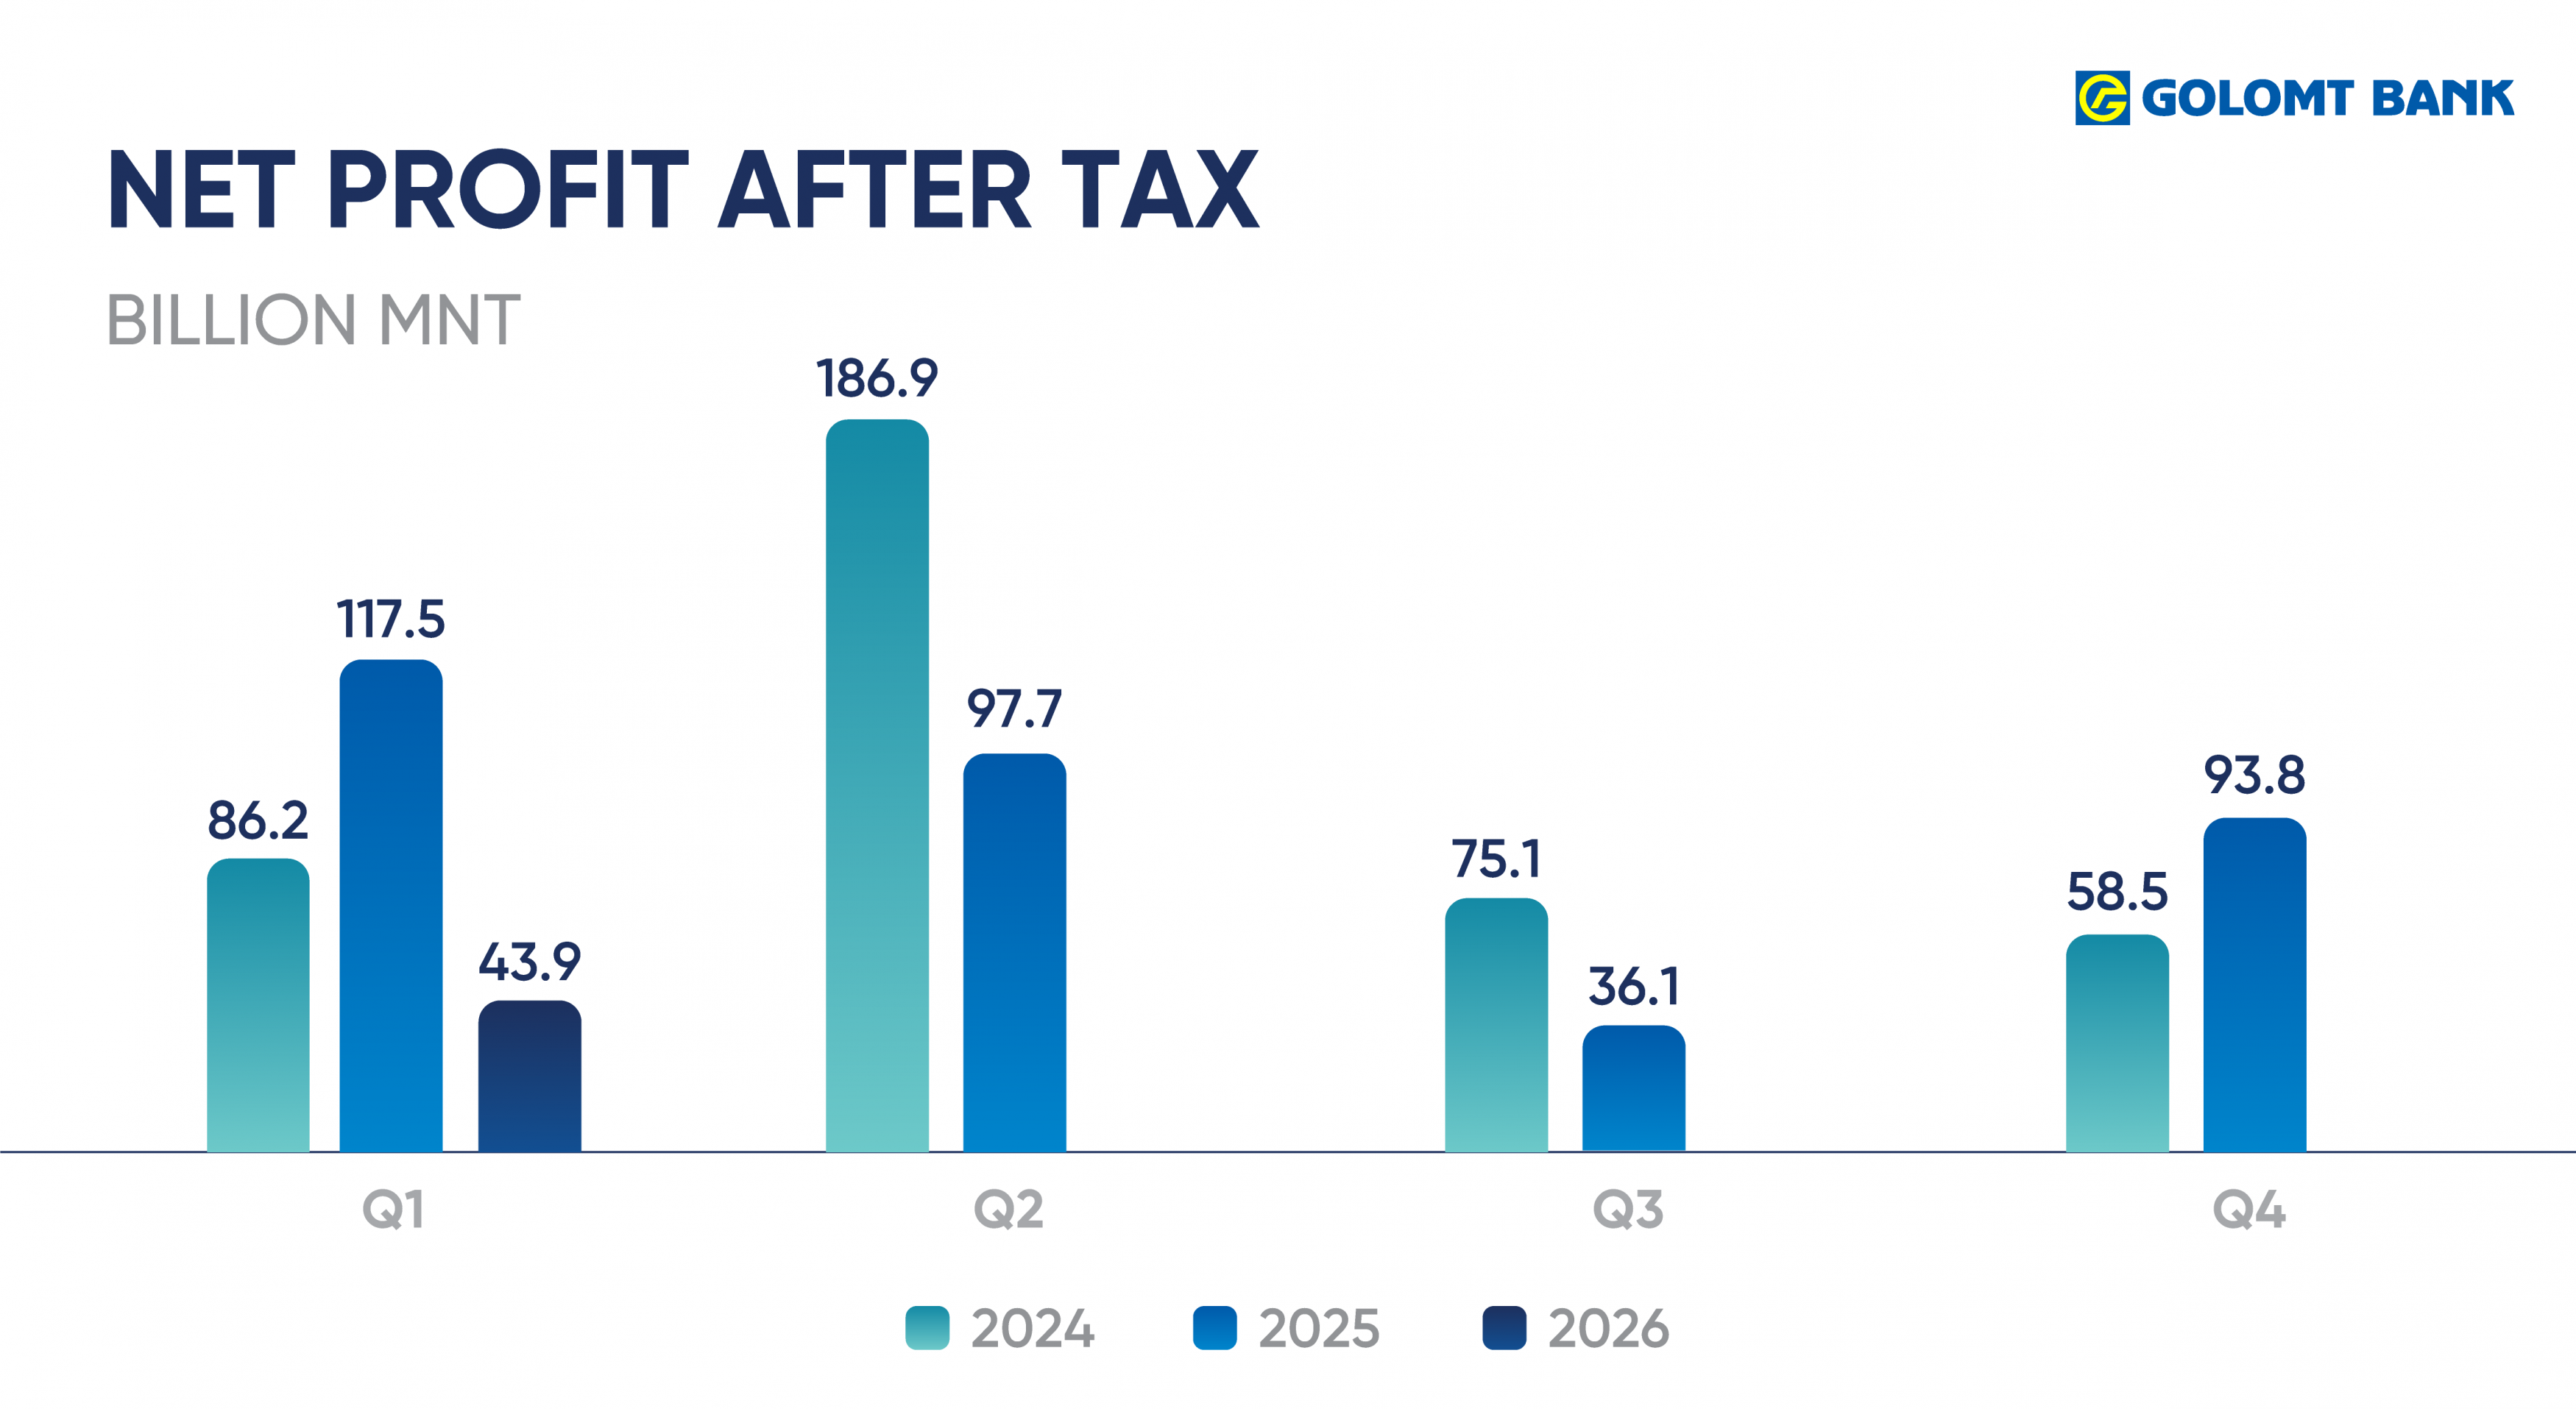
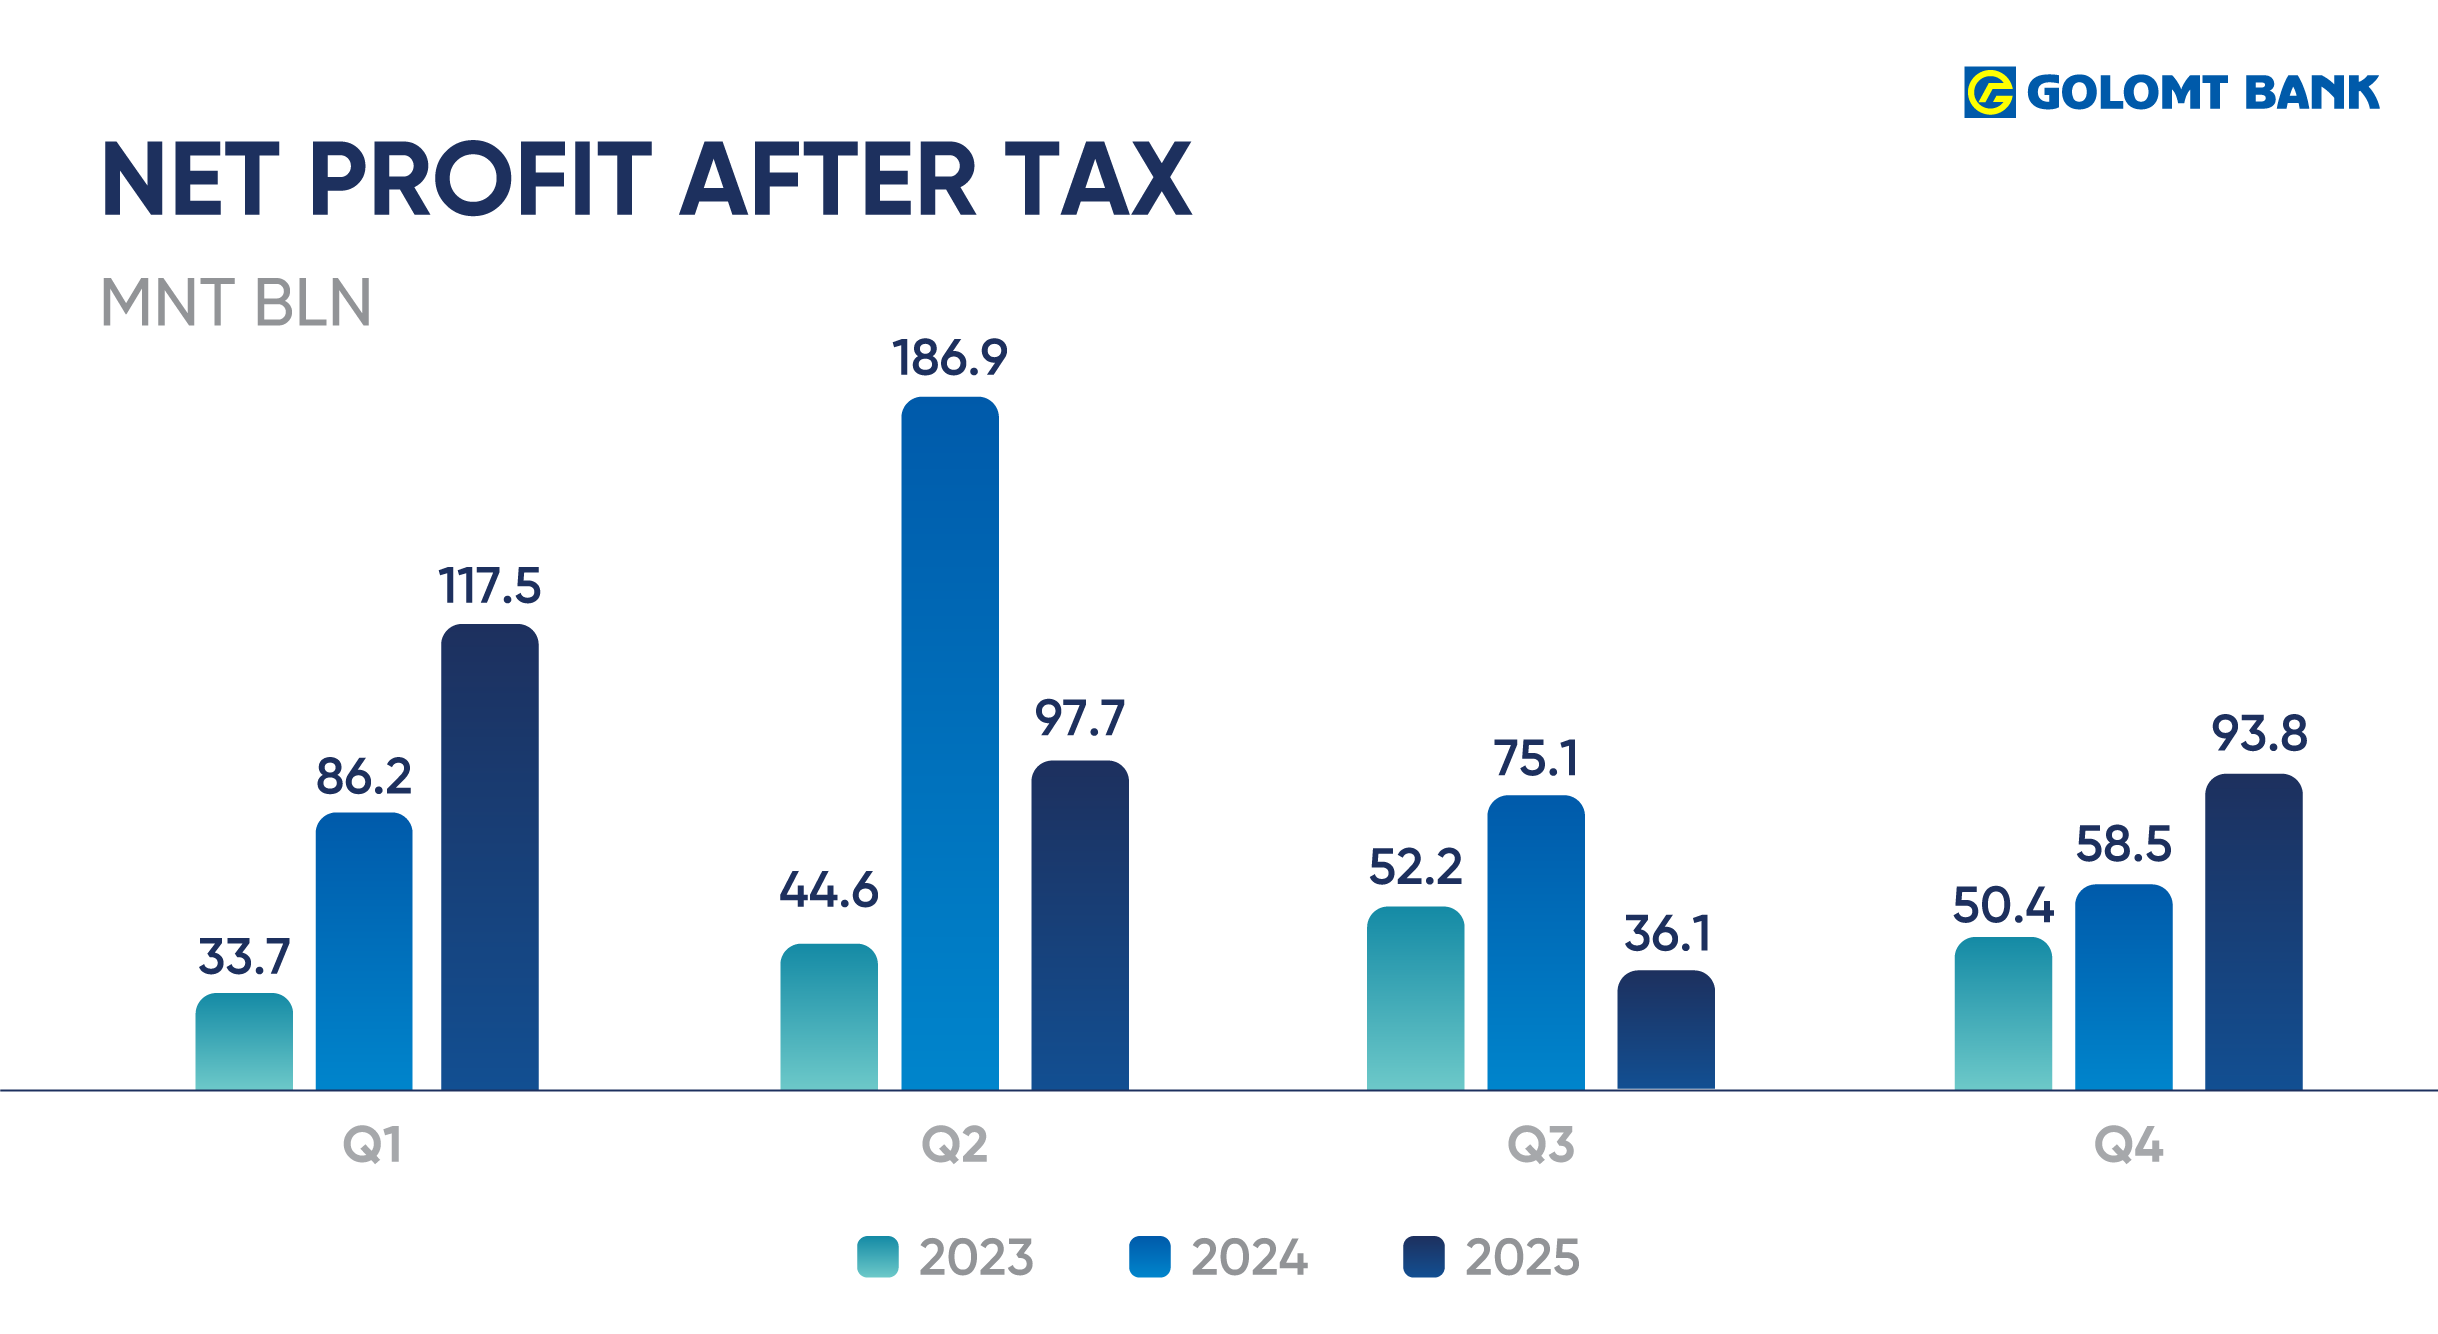
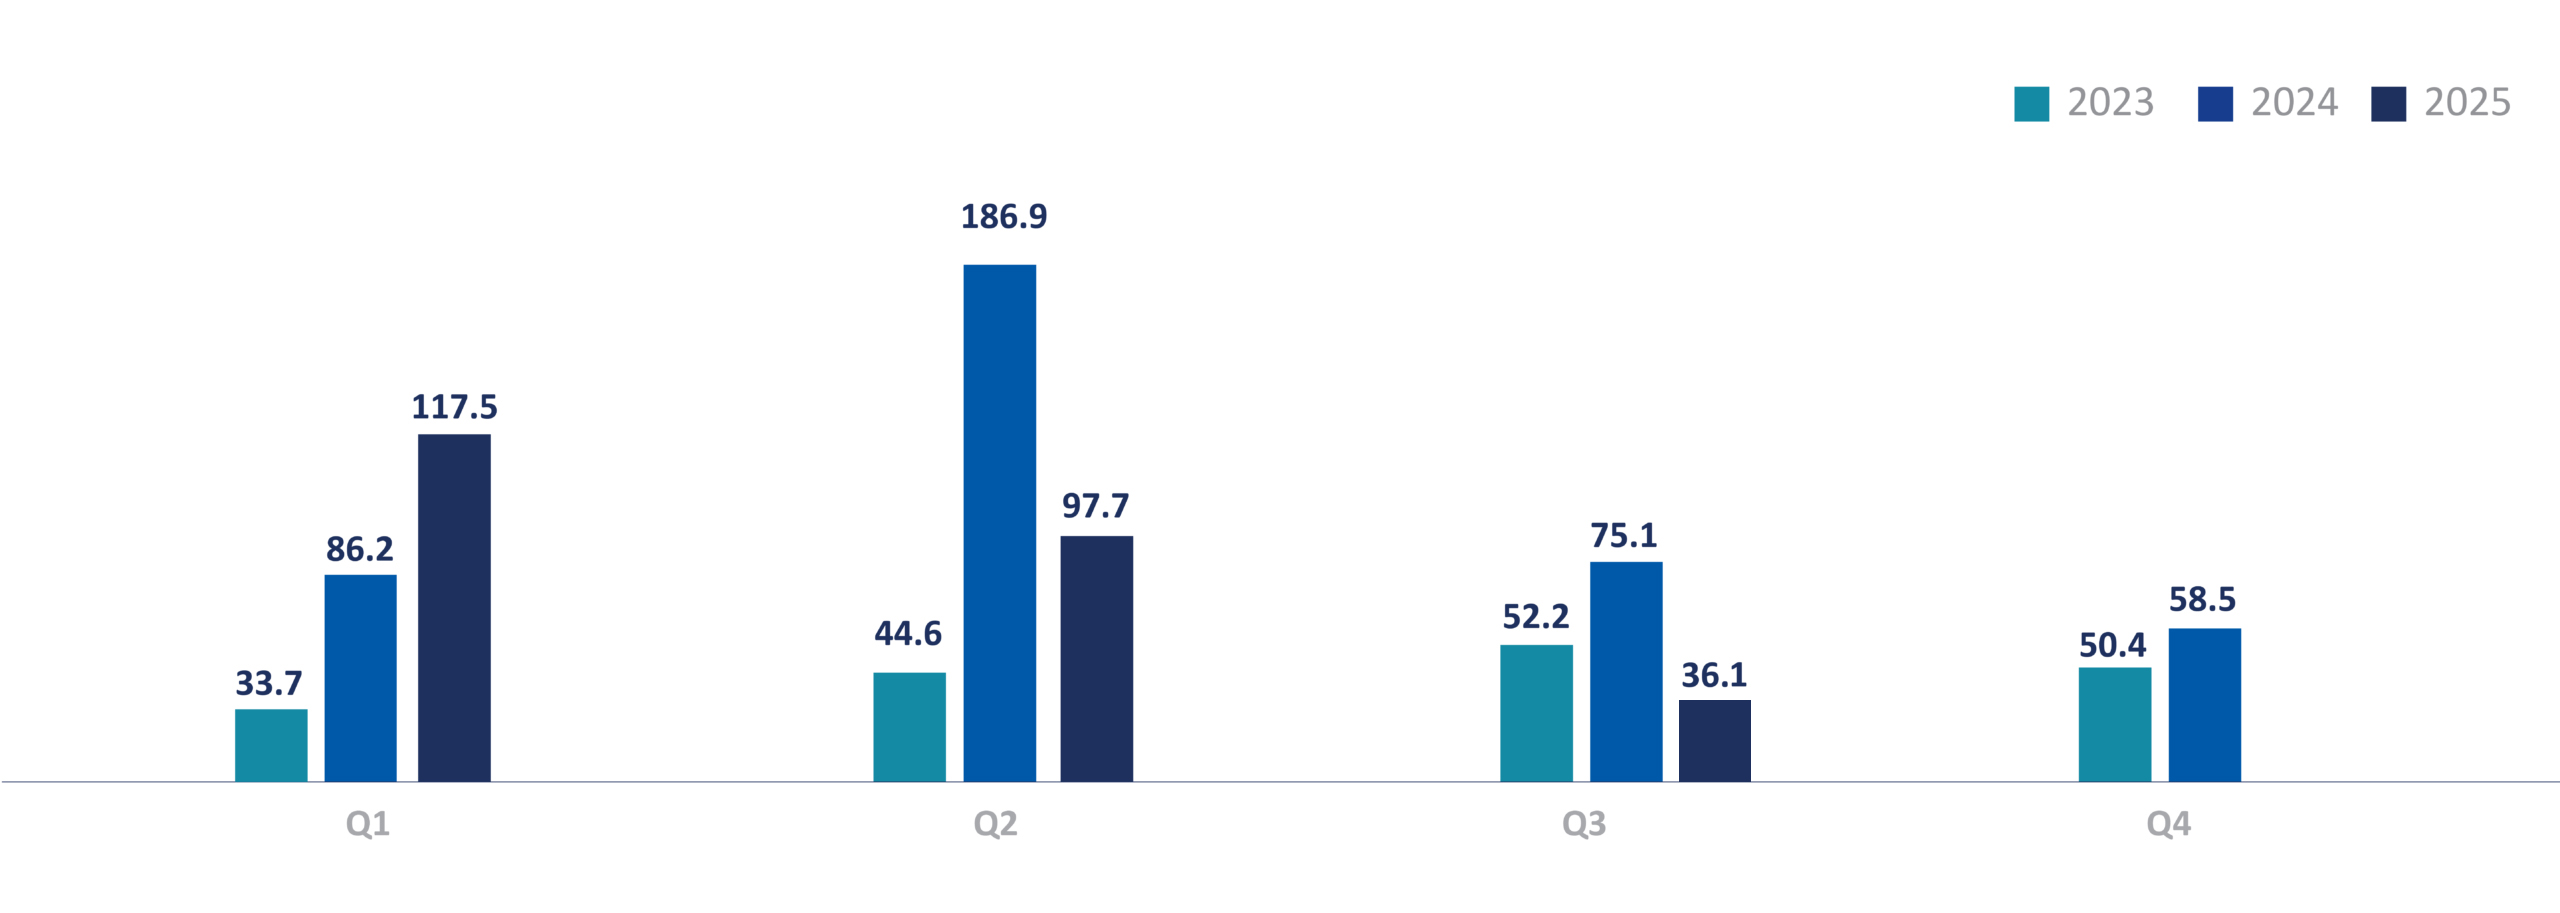
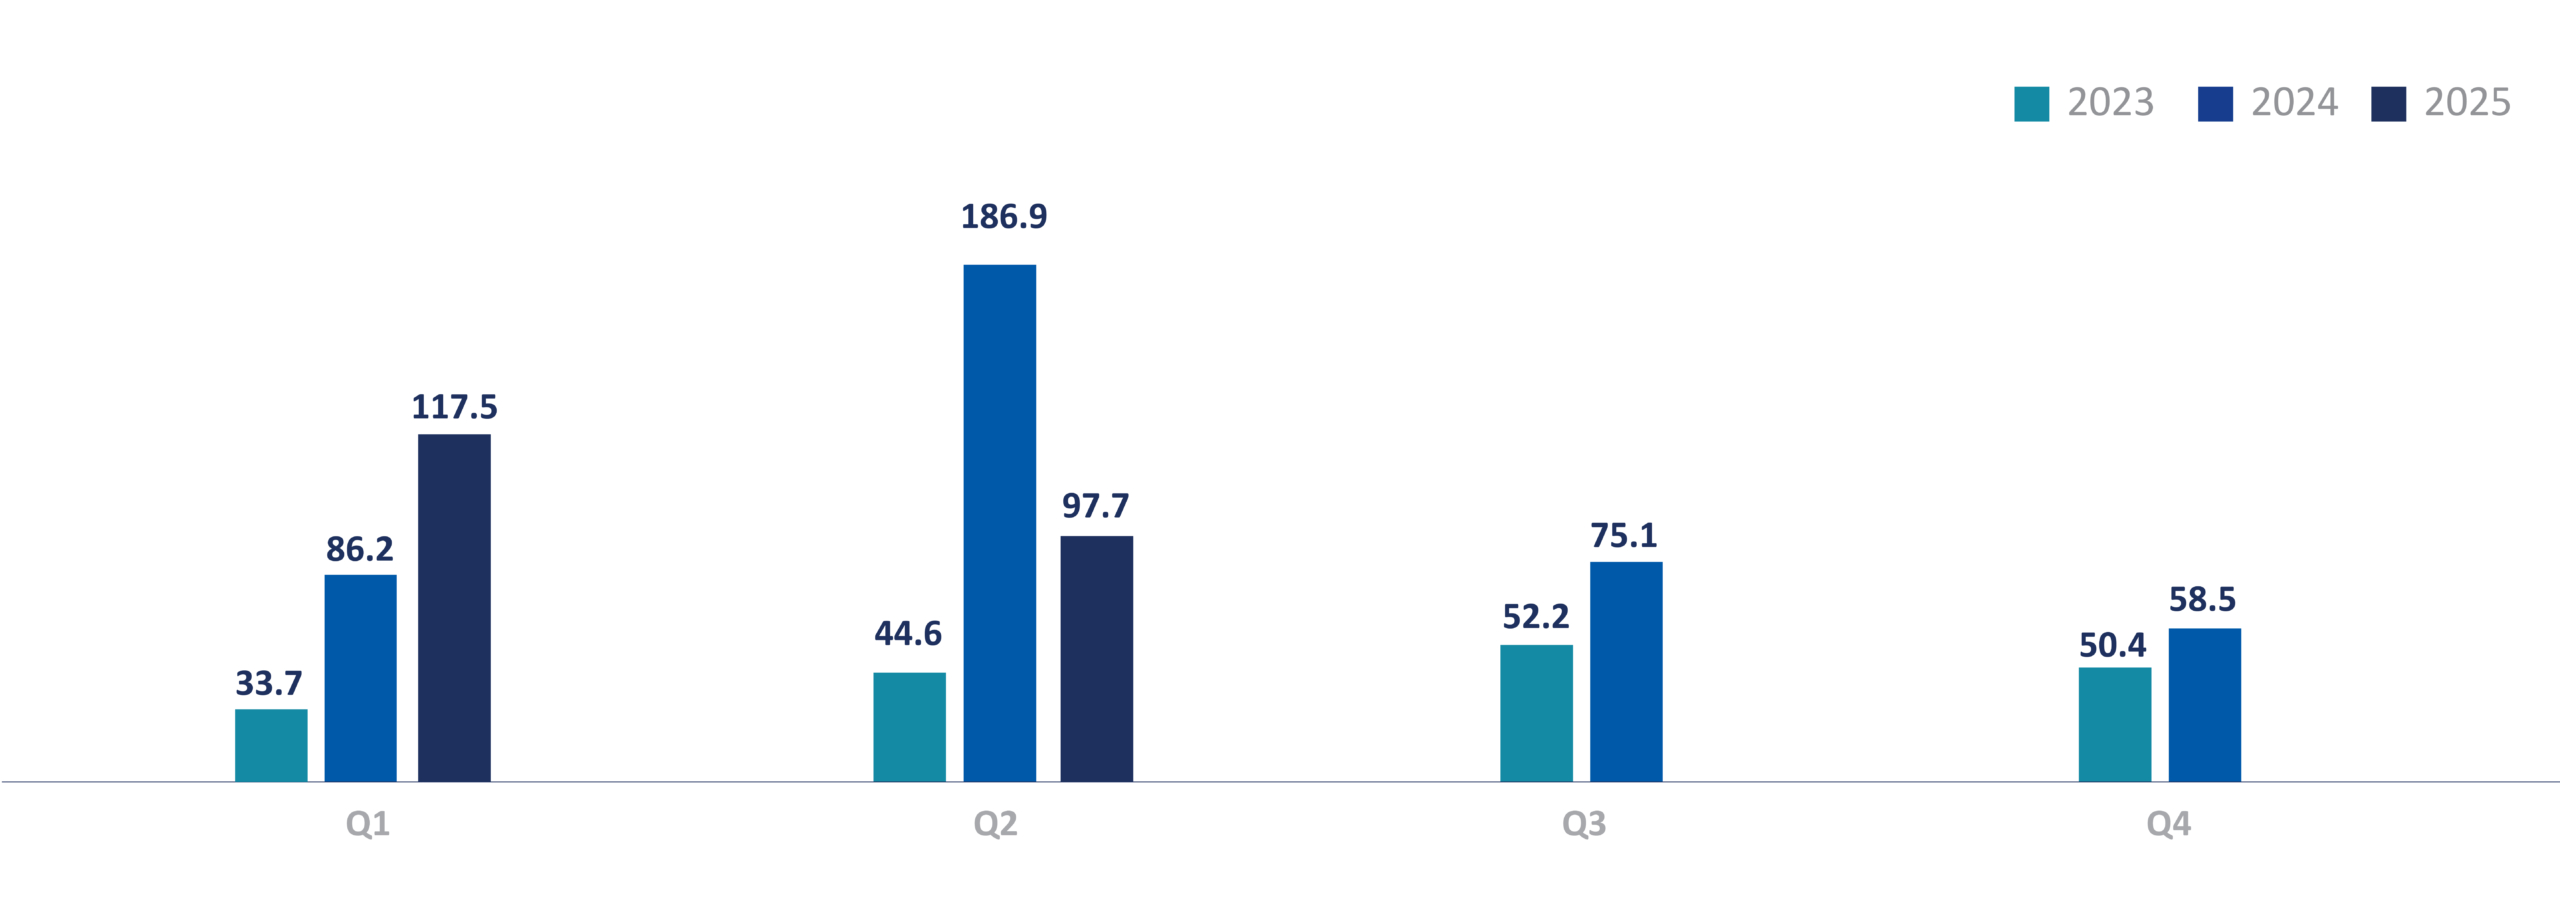
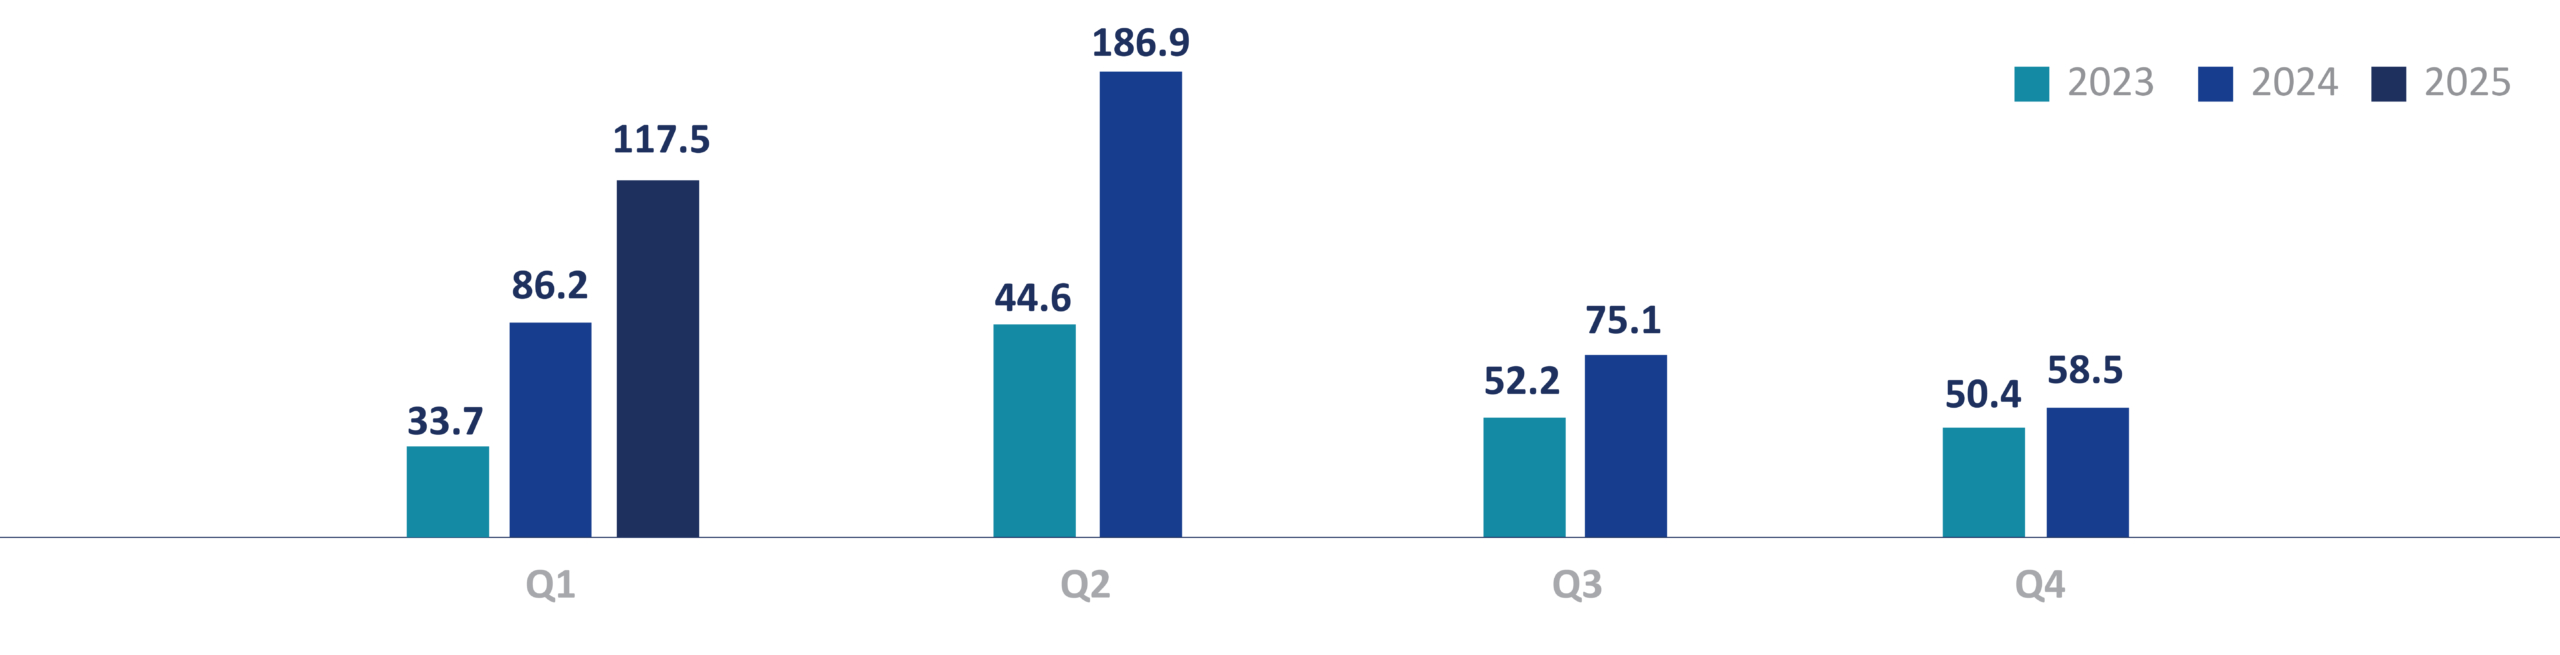
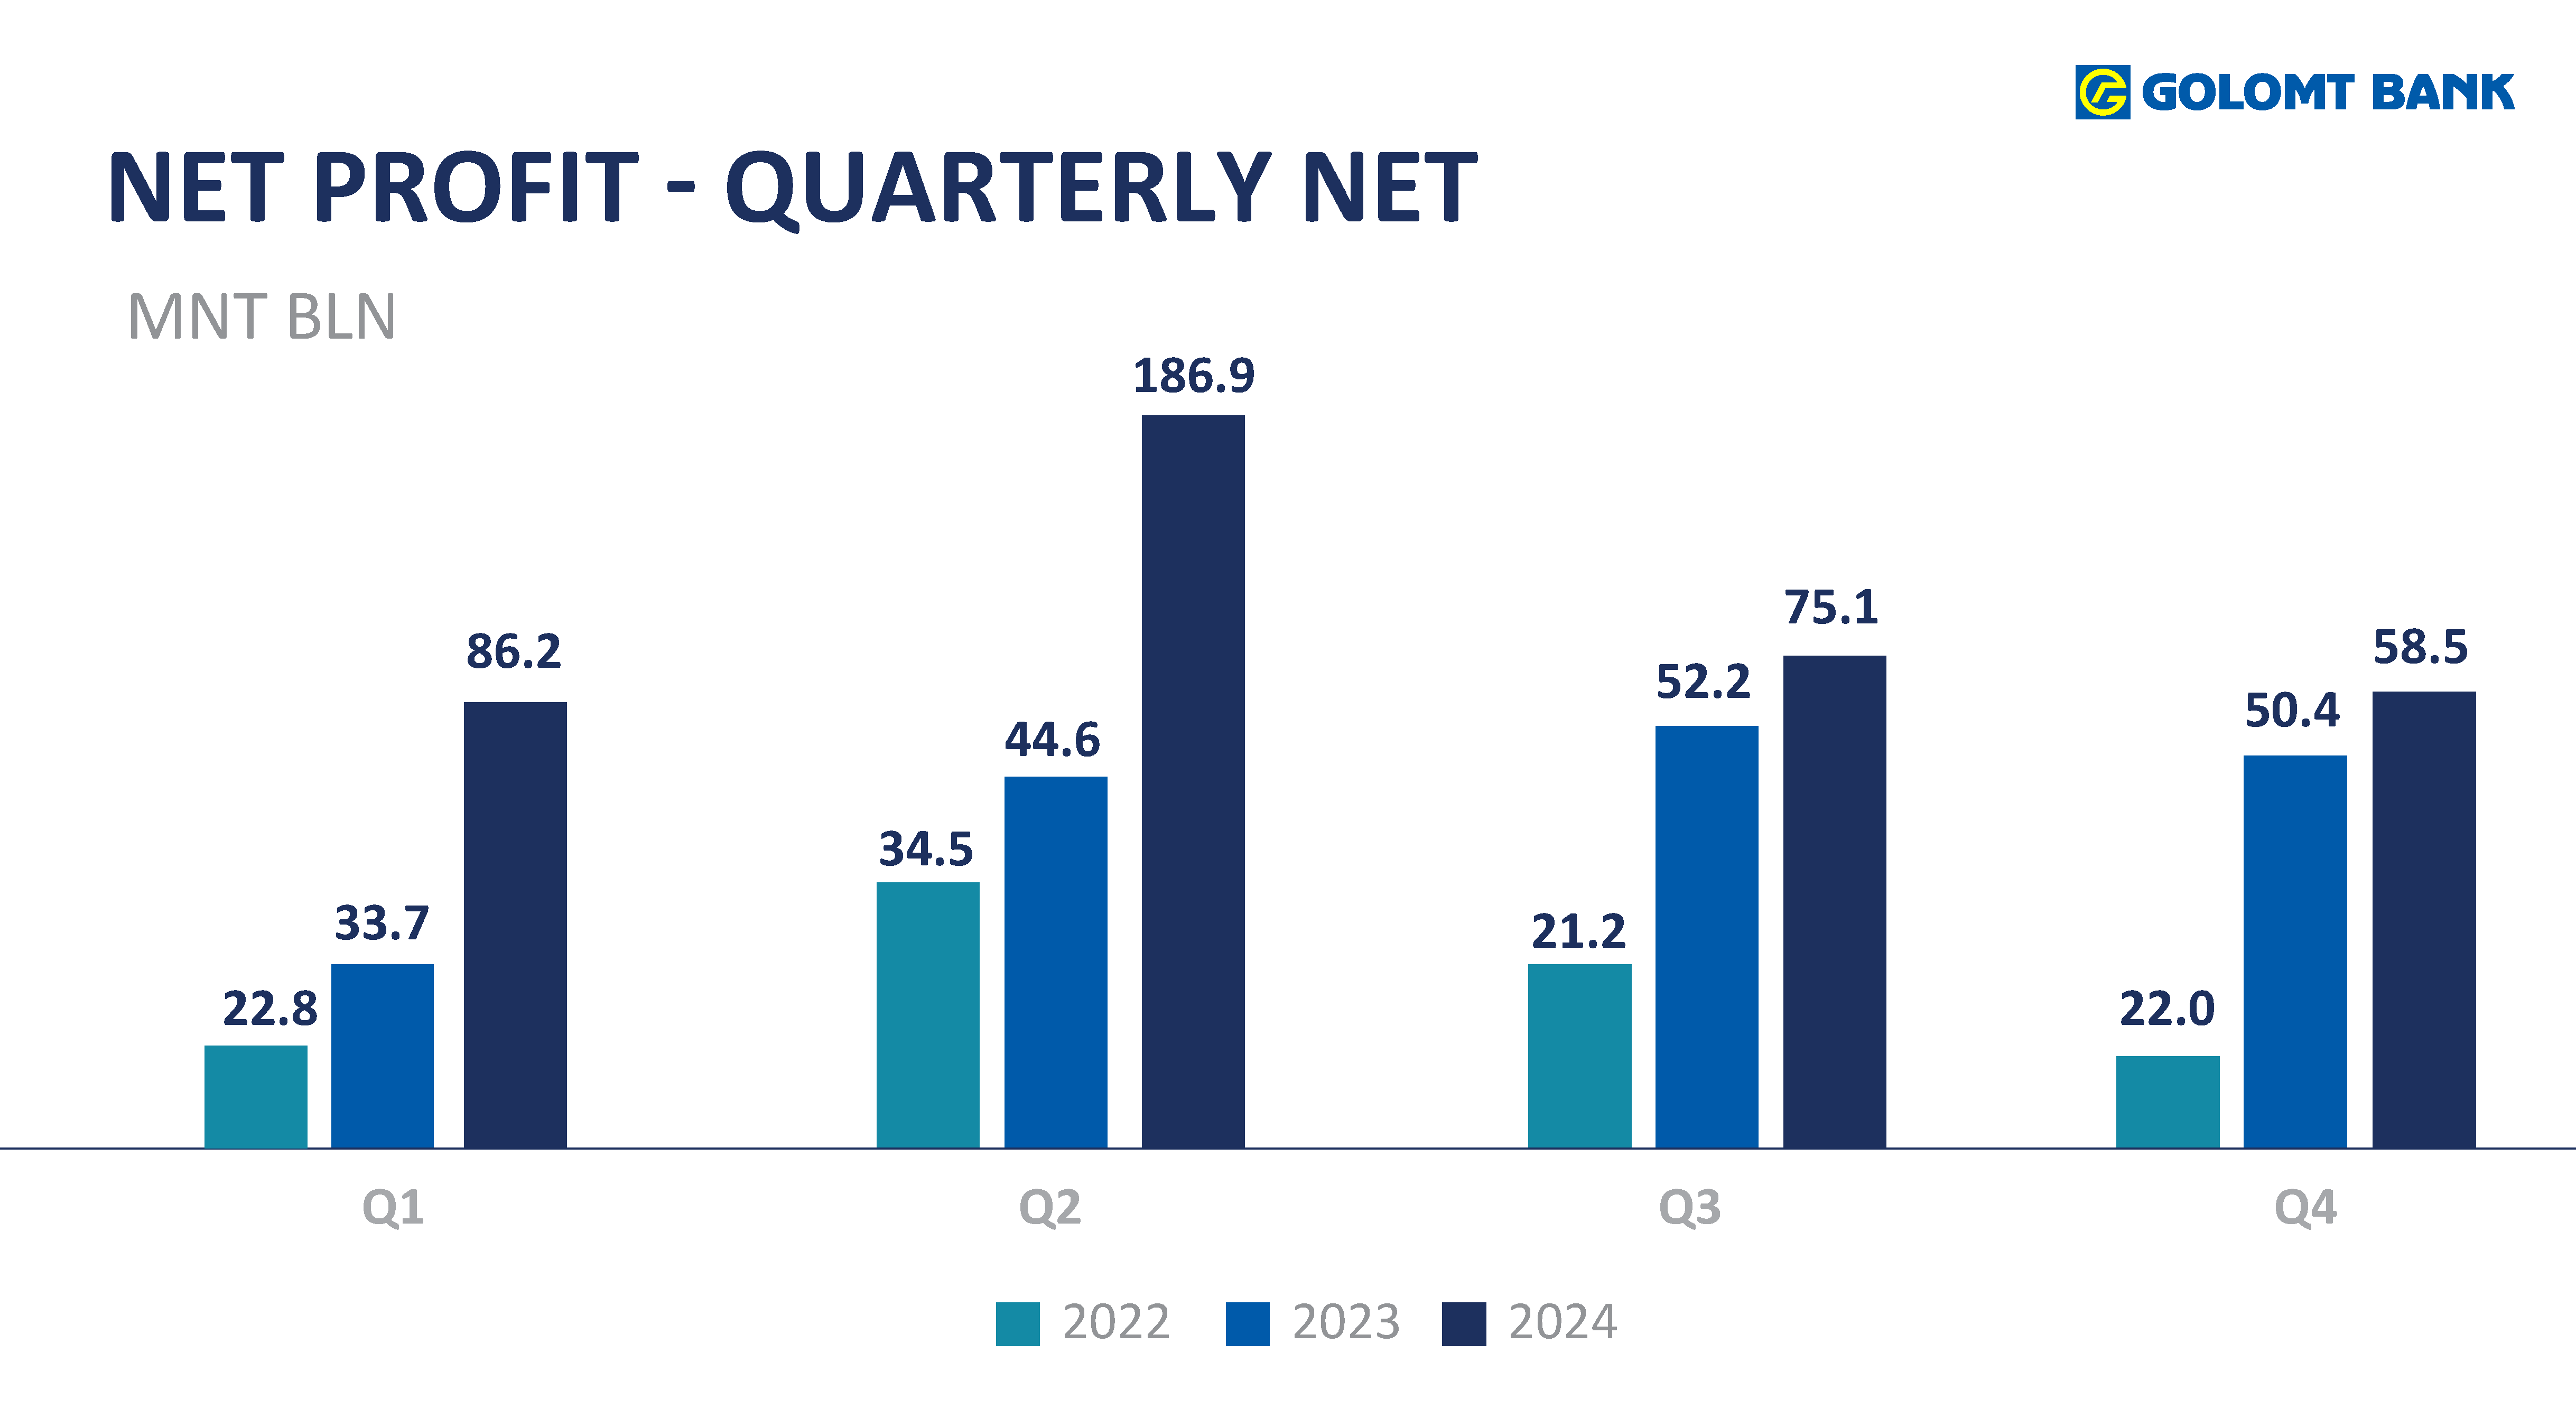
This website uses google analytics
This website uses information gathering tool which is Google analytic in order to determine the effectiveness of our online campaign in terms of sales and user activity on our sites.